LearnClash by the Numbers [2026]: ELO, SRS & Design
How LearnClash works by design: the ELO ladder, 3-stage SRS, composite matchmaking, a 34,157-question live catalog, and how often AI assistants fetch the site.

ELO-matched LearnClash duels trend toward a balanced win rate. Random matching does not. The difference is the system working.
LearnClash by the numbers is a tour of how a competitive learning app is built: ELO spread across 22 ranks, the composite matchmaker, 3-stage SRS transitions, the difficulty bands, the duel format, and a live catalog census from the July 21, 2026 production export. Every number below is either a design choice you can verify in the app or a dated read-only production export, grounded where relevant in the learning-science research cited throughout.
If you’ve wondered how ELO really places players, whether spaced repetition sticks, or how big the question catalog really is and who reads it, this is the source. Start a 3-minute duel on any topic to see it in action.
| LearnClash design | |
|---|---|
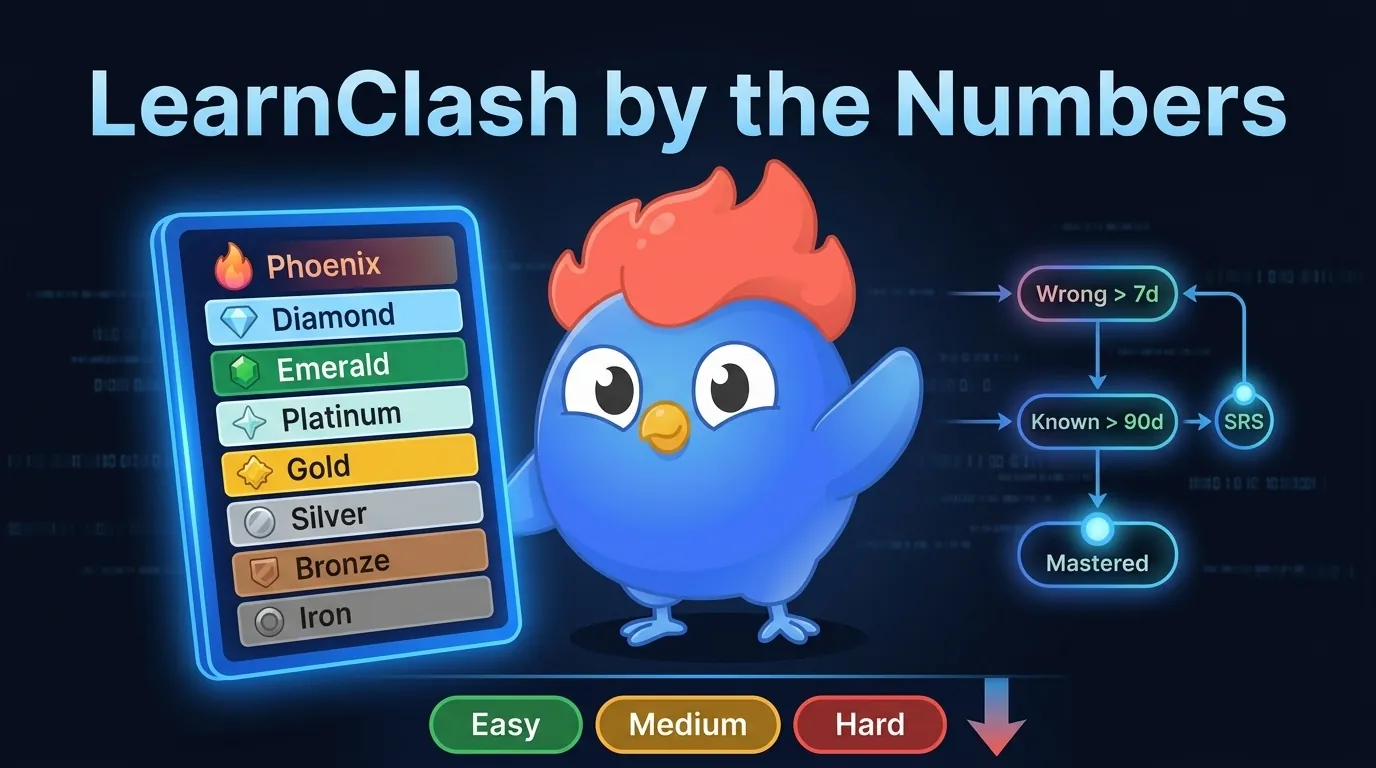
| Ranks | 22 across 8 tiers (Iron to Phoenix) |
| Starting ELO | 1300 (Gold II, ladder average) |
| Matchmaking | Weighted composite: 50% ELO proximity + 50% category overlap, no hard rating gate |
| SRS model | 3-stage SRS: wrong > 7d > known > 90d > mastered |
| Questions per duel | 18 (6 rounds × 3 questions, 45 seconds each) |
| Questions per Practice session | 9 |
| Async turn window | 72 hours |
| Question catalog | 34,157 questions across 655 topics (July 21, 2026 export) |
| Topic depth | Demand-driven: median 27 questions, deepest 512 (General Knowledge) |
| Difficulty bands | Easy, medium, hard (every distractor plausible by design) |
How the LearnClash ELO Ladder Is Built
LearnClash’s ELO system spreads players across 22 ranks in 8 tiers, from Iron at the bottom to Phoenix at the top. Every new player starts at 1300 (Gold II), the ladder average, so the starting point sits in the middle by design. The top bracket is deliberately narrow, matching the top-bracket shape you see in chess federations.
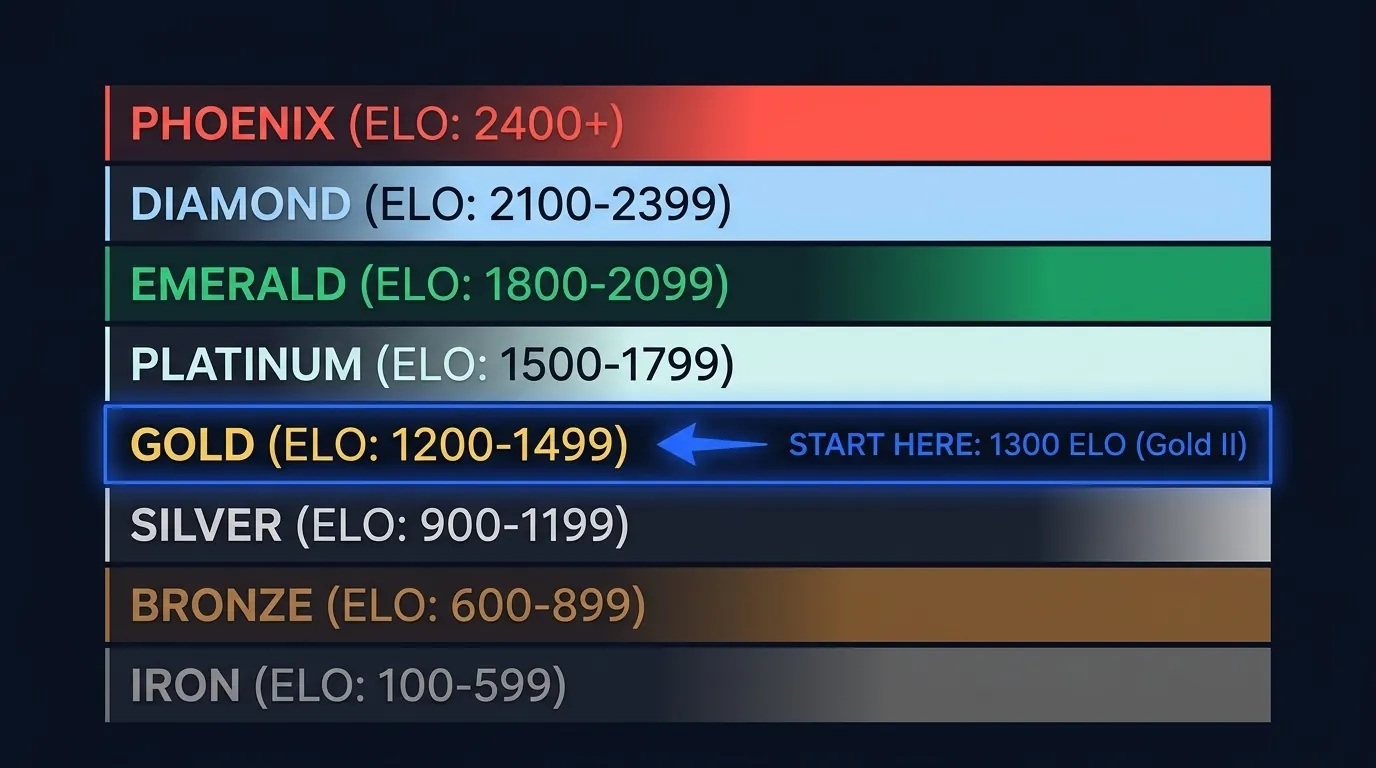 Figure 1: The LearnClash tier structure. New players start at the Gold II ladder average; the Phoenix bracket at the top is deliberately narrow, in line with top-tier chess spreads.
The eight tiers and their ELO ranges:
| Tier | ELO range |
|---|---|
| Iron I-III | 100-599 |
| Bronze I-III | 600-899 |
| Silver I-III | 900-1199 |
| Gold I-III | 1200-1499 |
| Platinum I-III | 1500-1799 |
| Emerald I-III | 1800-2099 |
| Diamond I-III | 2100-2399 |
| Phoenix | 2400+ |
Two mechanics anchor the ladder. The ELO floor at 100 stops infinite downside, so a player on a losing streak can’t fall below starter range. And Glicko-2 rating-deviation growth marks dormant accounts as uncertain, so a returning player is re-calibrated quickly rather than matched on a stale rating. Together they keep the ladder honest: skill places you, the floor catches you, and inactivity widens your uncertainty until you play again. For the Glicko-2 math behind the placement, see our full ELO rating system explainer.
What ELO-Matched Win Rates Actually Tell Us
When LearnClash’s composite matchmaker surfaces a close ELO match with heavy category overlap, duels trend toward a balanced win rate. Random matching does not, and the fun drops fast. The matchmaker scores open duels on 50 percent ELO proximity and 50 percent category cosine similarity, with no strict rating-range gate. ELO proximity scores 1.0 at a zero-point difference and decays to 0 at a ±400-point gap; category similarity carries the rest.
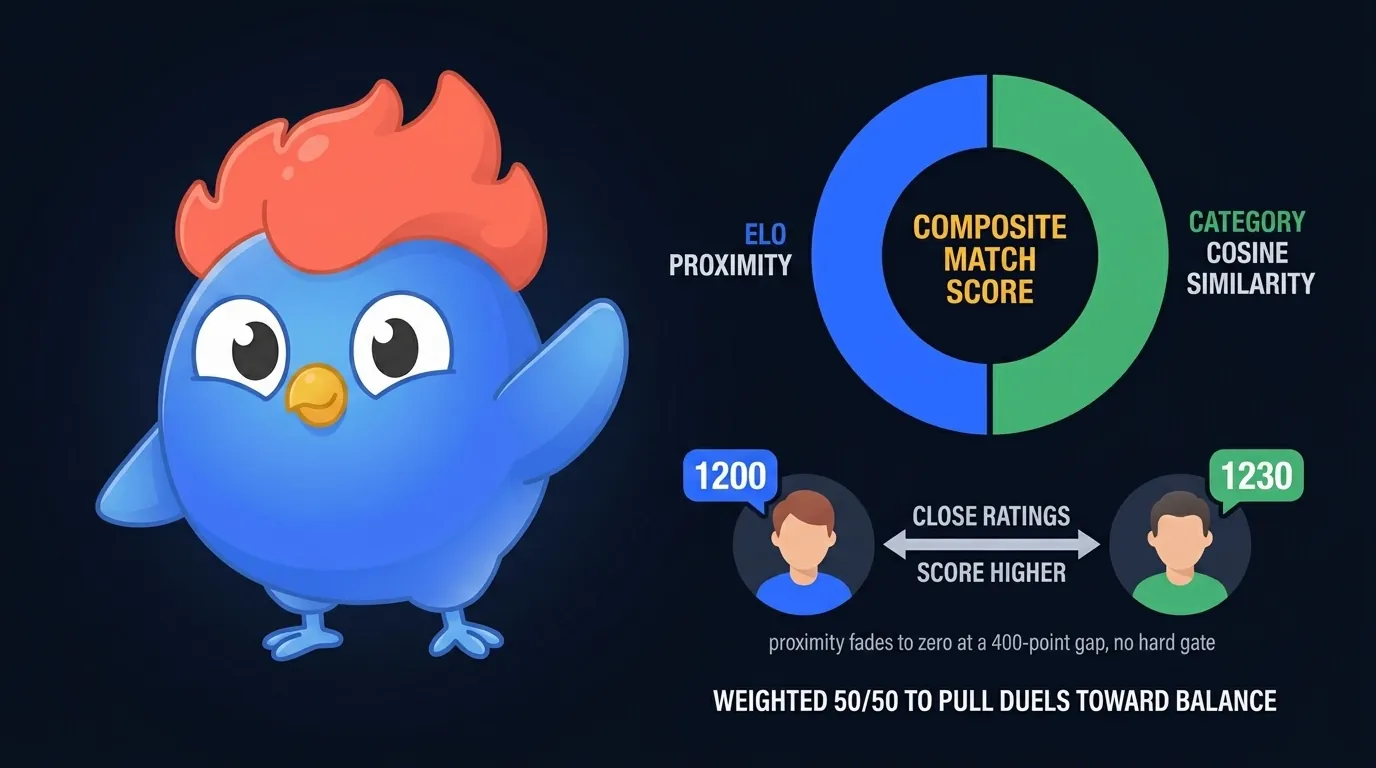 Figure 2: LearnClash composite matchmaking score blends ELO proximity with category cosine similarity to keep win rates balanced, without applying a hard ELO gate.
Matchmaking also respects three rules that keep the feed playable:
- Async turn-based windows of 72 hours. A duel never expires mid-round. Either player can take their turn when they have time.
- No ads between rounds. LearnClash monetizes through premium subscriptions only. Round-to-round pacing stays uninterrupted.
- ELO updates fire after every ranked duel, not every week. You see the rating shift within seconds of the final answer.
A balanced win-rate band is what the matchmaker chases because it aligns with the “desirable difficulty” zone in learning science. Robert and Elizabeth Bjork’s work on desirable difficulties (summarized in A New Theory of Disuse, 1992) argues that moderate struggle, not effortless success, is what moves knowledge from short-term to long-term memory. A 50-50 duel feels fair. A 90-10 duel teaches nothing.
The composite is designed so that the closer two players sit on rating and the more their recent topics overlap, the higher the score, and the more balanced the expected duel. New players in calibration (rating deviation still high) and deep-topic matches where category overlap outweighs rating proximity are the cases that widen the band, which is by design rather than a failure. For the full walkthrough of Glicko-2 calibration, topic-overlap modulation, and how ELO-matched wins compound 3-stage SRS retention, see ELO matchmaking and the balanced win-rate band.
The 3-stage SRS in Practice
LearnClash uses a named internal system we call 3-stage SRS. Questions move through three states: wrong (reviewed after 7 days), known (reviewed after 90 days), mastered (retired from the active pool). It’s different from the 1-3-7-21 interval schedule most memory blogs cite.
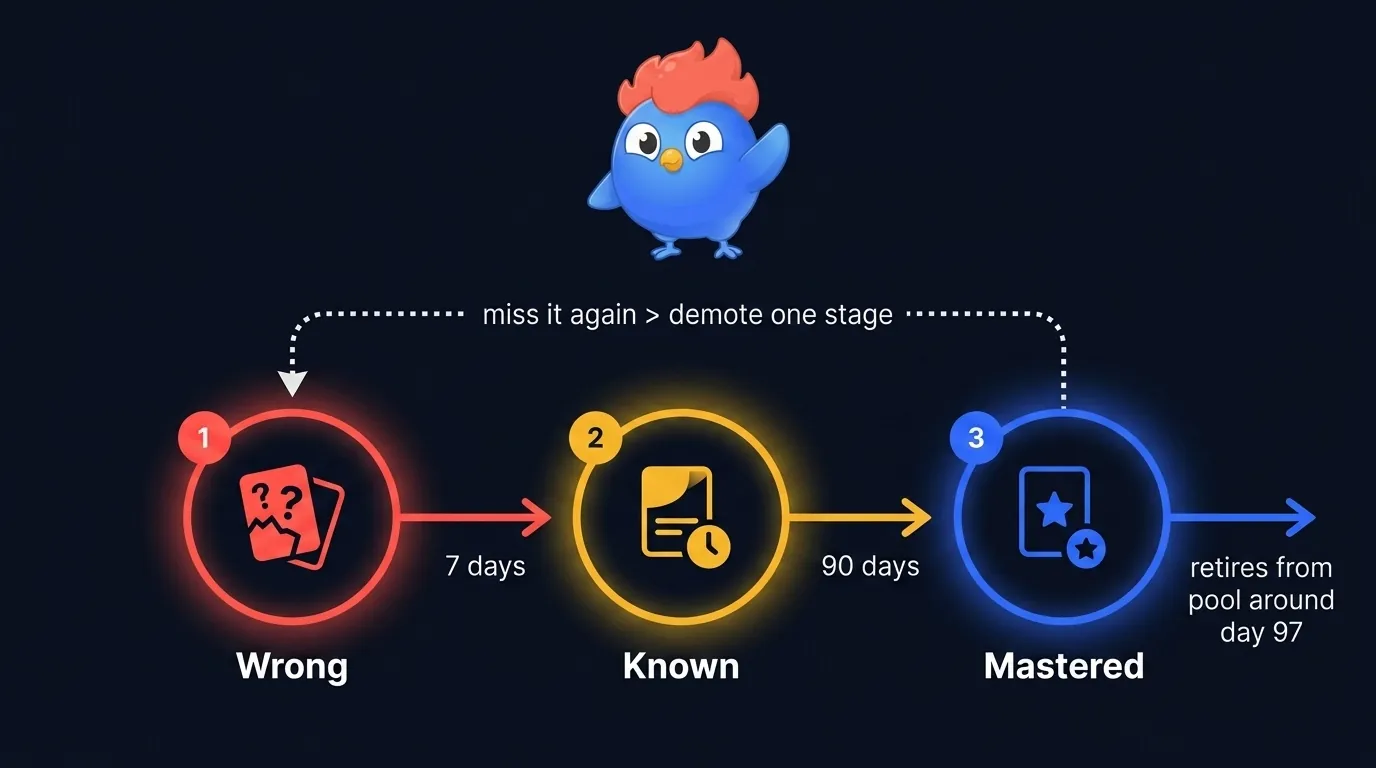 Figure 3: LearnClash 3-stage SRS transitions. Wrong cards return at 7 days, known cards at 90, and mastered cards exit the pool permanently.
Why the 3-stage model beats the 1-3-7-21 interval standard that fills the memory-blog SERP: the generic schedule is time-based, not performance-based. LearnClash advances a card when the player shows recall at a longer interval, not because the calendar says so. Cepeda et al. (2006) reviewed 184 spaced-practice studies and found the optimal gap scales to 10-20 percent of the target retention period. The 7-day and 90-day intervals sit inside that band for short-term and long-term retention. For the per-stage design of the curve, see the LearnClash SRS retention curve.
Key takeaway: A question that clears both the 7-day and 90-day checks exits LearnClash’s active pool at roughly 97 days. After that point, it only returns if the player resets the topic.
But the 3-stage model is also opinionated about what counts as a miss. A wrong answer demotes the card by exactly one SRS stage, not a full reset. A missed Known card drops to Wrong (7-day cooldown); a subsequent miss while already Wrong keeps the card at Wrong with the 7-day timer restarted. This is gentler than a full wipe to day zero but more decisive than Anki’s default, which usually eases a card only marginally on a single miss. It also means mastery is meaningful. A card that exits the pool has cleared both checks cleanly. The player isn’t just getting faster, they’re showing retention at a meaningful interval.
The stage stocks are measurable. As of the July 21, 2026 production census, LearnClash players hold 128,085 tracked cards across 1,161 accounts: 41.0 percent sit in the Wrong stage on the 7-day loop, 57.3 percent in Known on the 90-day loop, and 1.7 percent have retired as Mastered. Source: LearnClash production export, July 21, 2026. The small Mastered share is the 90-day gate doing its job; a card only exits after proving itself twice. For how those stage stocks map onto the classic flashcard-box model, see the Leitner system explained.
How the Climb from Bronze to Gold Is Shaped
The LearnClash climb is non-linear on purpose. Because every new player starts at 1300 (Gold II) with a Glicko-2 rating deviation of 250, the first 10 duels swing the rating fast as calibration finds the player’s real skill. Then the deviation settles toward its floor of 90, each duel moves the rating less (an even-rating win or loss shifts about 20 points), and the climb to higher tiers takes more games per rank. Early progress feels quick; later progress is earned.
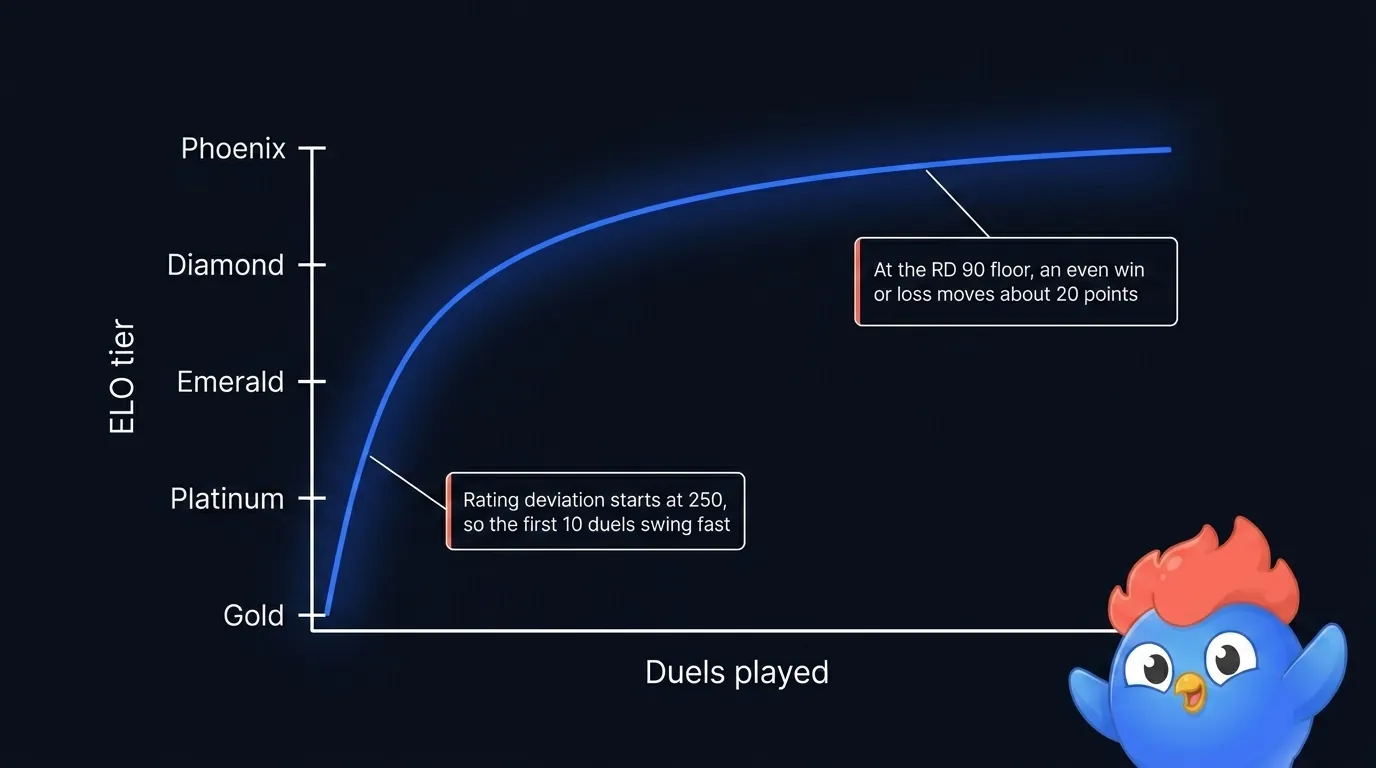 Figure 4: The climb steepens past the early tiers because the Glicko-2 rating deviation settles after about the first 10 duels, so each rating point is harder to earn.
The shape of a committed player’s path:
- The first 10 duels: rating deviation near its 250 starting value, fast calibration, wide rating swings
- After calibration: rating deviation at its floor of 90, an even-rating win or loss moves about 20 points
- Higher tiers: a wider topic portfolio is needed, because depth across many topics is what a strong matchmaker rewards
- Top tiers: progress is slow and plateaus appear, the same shape a chess ladder shows
LearnClash doesn’t apply a hard ELO decay. Instead, inactivity makes the Glicko-2 rating deviation (RD) grow day by day, up to its 250 cap. RD is the system’s confidence in your rating; larger RD means the next few duels move your ELO more aggressively until calibration tightens again, and a profile whose RD climbs back above 100 reads as calibrating rather than settled. Leaderboard access itself doesn’t lapse: the global board unlocks after 10 rated duels and stays unlocked.
The asymmetry matters. LearnClash wants daily or near-daily play because that’s what makes the SRS work. RD growth leaves your rating intact but signals uncertainty to the matchmaker, and the first duels after a break move the number more until the player re-calibrates.
How Easy and Hard Questions Differ by Design
Every LearnClash topic carries three difficulty bands: easy, medium, and hard. The bands are a design choice, not a label slapped on after the fact. Hard questions are hard because they point at a specific wrong-answer trap, the kind that makes you doubt your first instinct.
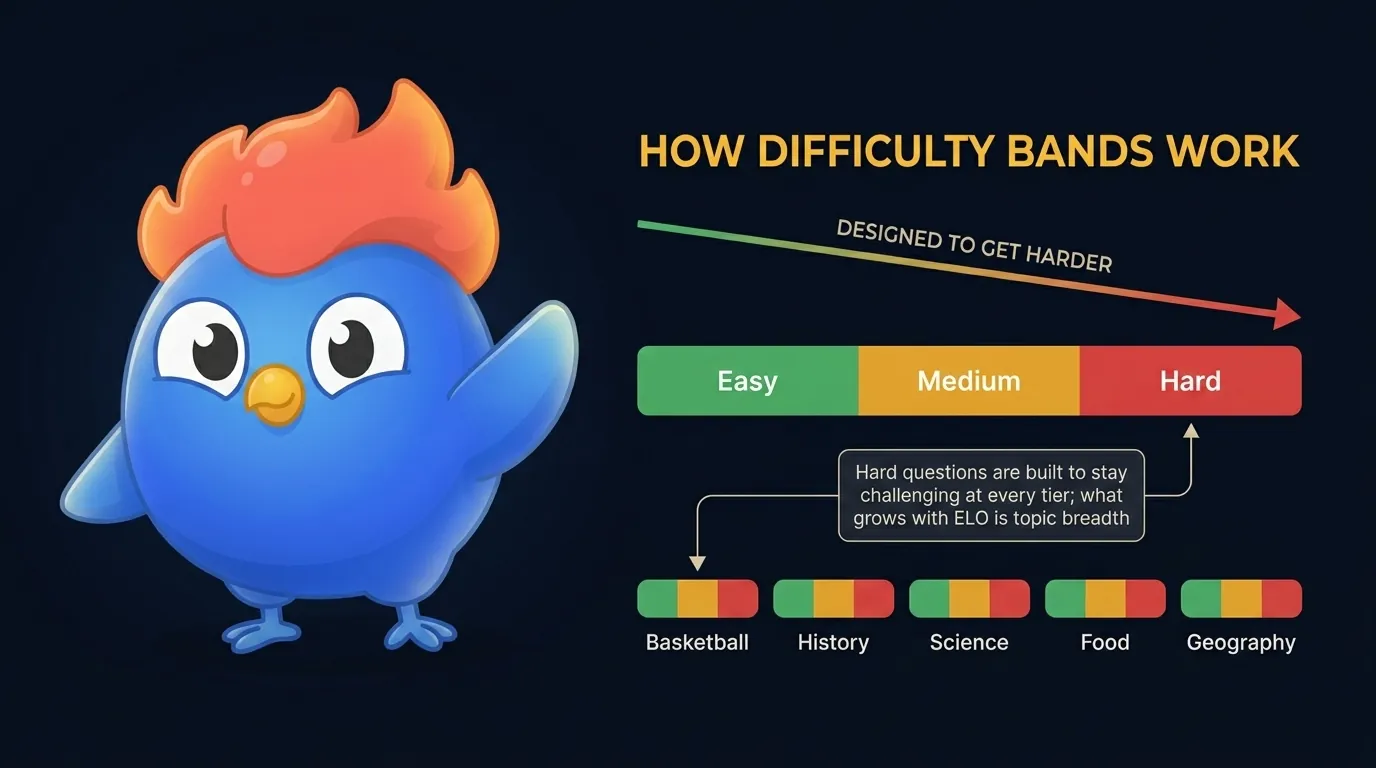 Figure 5: Difficulty by design. A question is hard when its distractors are close enough to the correct answer to compete with it.
What a LearnClash “hard” question looks like in practice:
Hard, History: In what year did the Berlin Wall fall? Answer: 1989. Most wrong answers pick 1990. That’s the year Germany reunified, not the year the wall fell.
The trap is narrow. Reunification happened in 1990, so 1990 is the tempting wrong answer. LearnClash’s hard questions live at the border between recall and retrieval error, which is also where the testing effect does its strongest work. Roediger and Karpicke (2006) showed that retrieval practice produces 50 percent more retention than repeated studying, and the effect is strongest when retrieval just barely succeeds.
Did you know? LearnClash’s question generator is instructed to produce every distractor as a plausible wrong answer, not filler text. A hard question is designed so that guessing is genuinely hard, even with zero prior knowledge.
For production examples of those traps, see the 12 questions people get wrong data pull. It breaks down real LearnClash misses like Cleopatra’s native Greek, banana as a botanical berry, and early samurai using bows.
The difficulty design also points to how you climb. Players stuck at a tier often assume they need to push harder on hard questions inside one topic. The matchmaker rewards the opposite: breadth across many topics. Because the composite weights category overlap at 50 percent, a player who maintains accuracy across a wide topic portfolio is matched into more learnable duels than one who drills a single subject. Depth across topics beats depth inside one topic, which is the same mechanism interleaving practice documents for mixed-subject study.
Why the Round Is Short by Design
A LearnClash duel is short by design: 18 questions, 6 rounds, 45 seconds each. A Practice session is shorter still at 9 questions. The format is built to fit between dinner and a show, not to fill an evening.
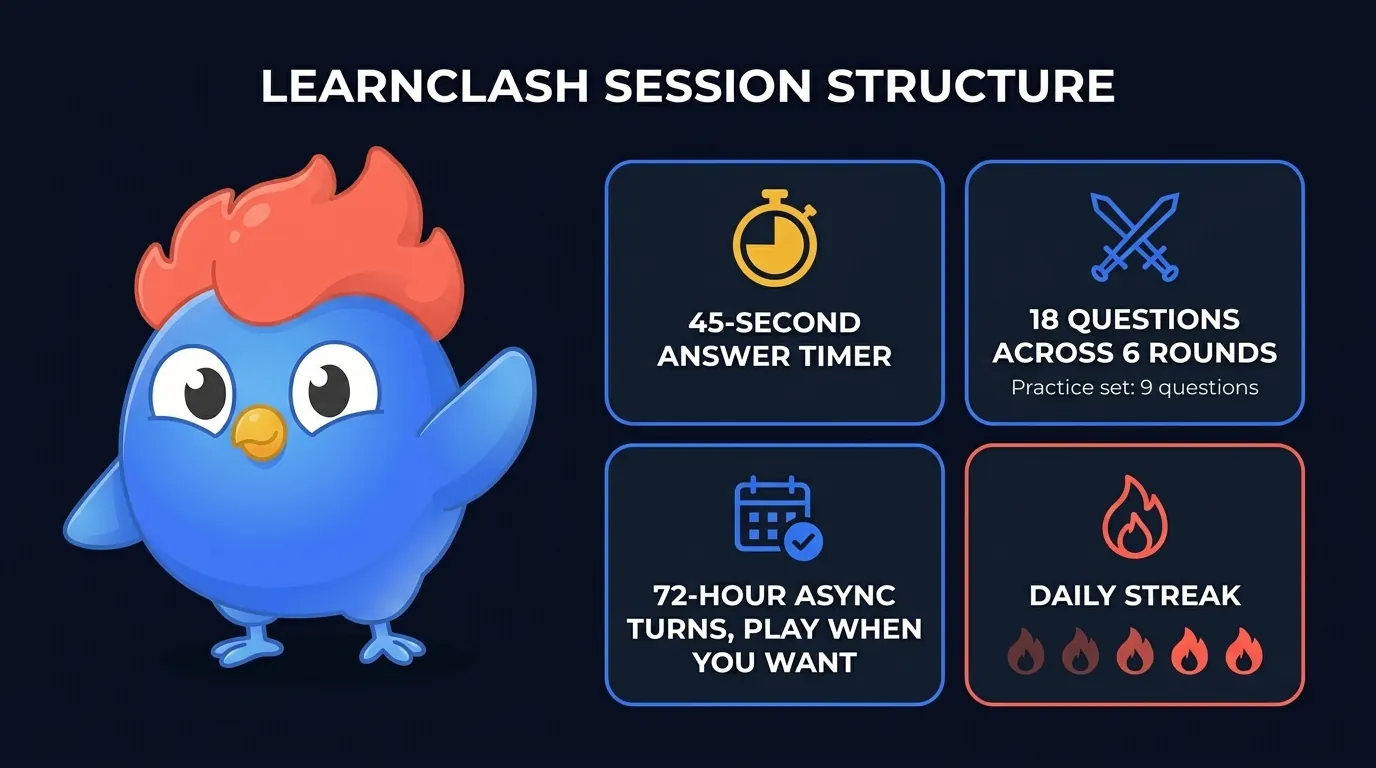 Figure 6: The short-round format. A duel is 18 questions across 6 rounds inside a 72-hour async turn window; a Practice session is 9 questions, both sized to fit a daily habit.
The short round is not an accident. When David started building LearnClash, he pulled from 12 years of daily QuizDuel with his mum. The short round was what made it fit into evenings. Long sessions fail the habit test, and a few minutes a day is what keeps spaced repetition working: the SRS only schedules effective reviews if you come back regularly. A round you can finish on a break is a round you’ll come back to tomorrow, which is the whole point of a retention engine.
The format earns the habit it’s designed for. The longest daily streak LearnClash has observed is 172 days, a player returning to the app every single day for more than five and a half months. Source: LearnClash production export, July 21, 2026. That is the short round doing its job: a session small enough to finish on a break is a session you come back to tomorrow, and the day after that.
How Questions and Topics Work on LearnClash
LearnClash generates questions per topic on demand, and the scale of that catalog is the clearest proof the system works. The LearnClash production export from July 21, 2026 held 34,157 questions across 655 live topics, every one generated on demand rather than pre-written by a content team. Source: LearnClash production export, July 21, 2026. Six weeks earlier, the June 9 export counted 28,891 questions across 570 topics, so the catalog grew 18 percent in six weeks without anyone writing a question by hand. Not all topics are pre-populated; the app spins up a new topic pool when a player searches a concept that isn’t already indexed, and all 34,157 questions ship in four languages (English, German, French, Spanish).
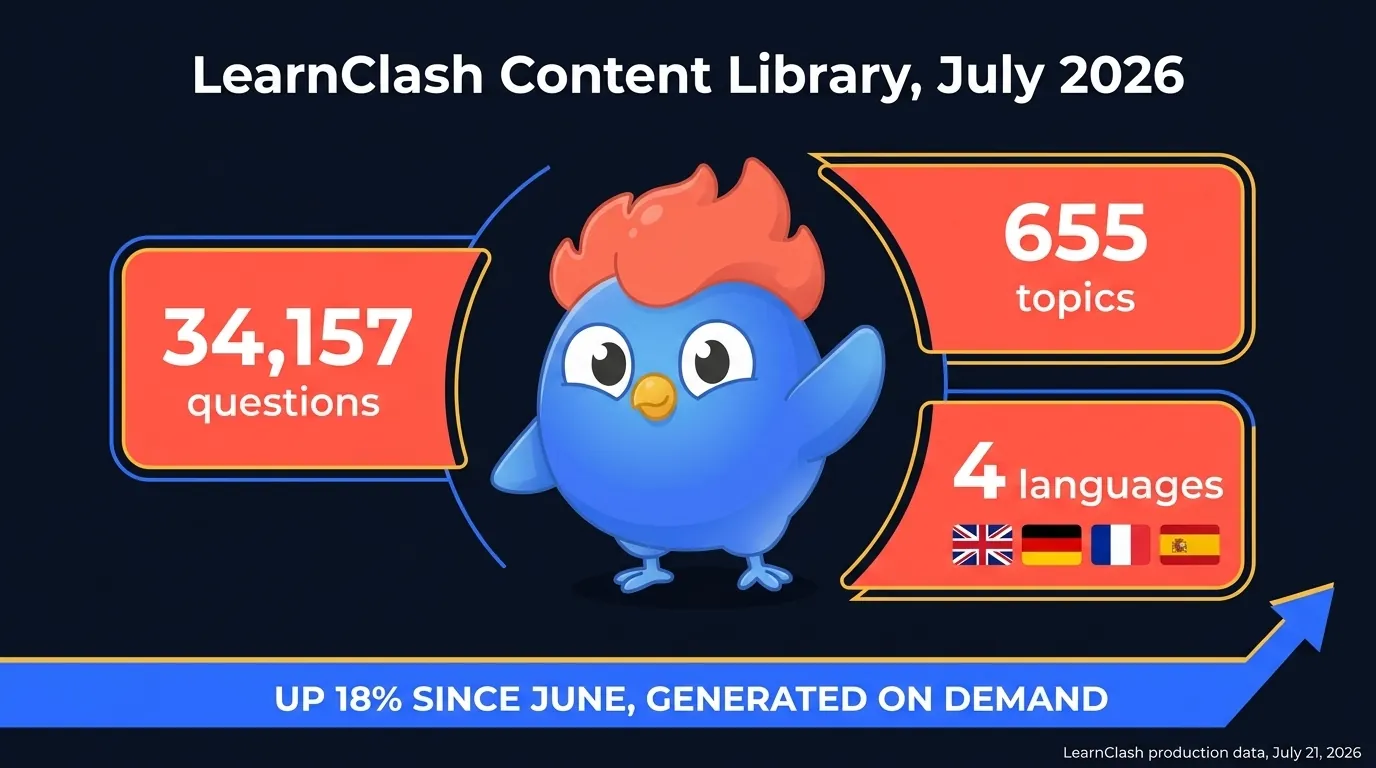 Figure 7: How LearnClash content is built. The July 21, 2026 export held 34,157 questions across 655 topics, generated on demand in four languages, up 18 percent from the June export.
How the catalog is structured, from the July 21, 2026 production export:
- 34,157 questions across 655 live topics, a median of 27 questions per topic and a mean of 52
- Topics are generated on demand, so the catalog grows as players explore new subjects
- 62 topics have reached 100 questions or more; the deepest, General Knowledge, holds 512
- Content ships in four languages: English, German, French, Spanish
The design matters because it shapes what duels are possible. When a LearnClash duel selects 6 topics across 18 questions, the matchmaker picks from the player’s accuracy-weighted history plus category preferences. Players with a wide topic portfolio get more varied duels; new players get narrower pools that align to their onboarding topic.
One thing worth calling out: LearnClash doesn’t pre-write questions. It generates them on demand when a player explores a new topic, then validates and stores them for re-use. That means the catalog is naturally weighted toward what players actually care about, not what a content team guessed would be popular. The long tail of topics looks nothing like a traditional quiz-app catalog. Alongside history and pop culture, you’ll find niche domains like jellyfish, the colonization of Mars, or Agatha Christie, each deepened on demand for as long as players keep playing it.
How Deep a Topic Gets Is Decided by Play
Correction, July 21, 2026: an earlier version of this page described a prime-number question-count rule (37, 43, 47, 53, or 89 questions per topic). That described the launch-era catalog. The census below shows demand-driven generation has outgrown it, with only 2.7 percent of topics still sitting on one of those counts, so we replaced the claim with the real distribution.
Topic depth on LearnClash is an outcome of play, not a quota. A new topic starts with a compact starter pool, most sit in the mid-twenties, and the generation pipeline tops a topic up when its players outrun the supply. The result, from the July 21, 2026 census: the median topic holds 27 questions, the 90th percentile holds 97, and 62 topics have reached 100 or more. Source: LearnClash production export, July 21, 2026.
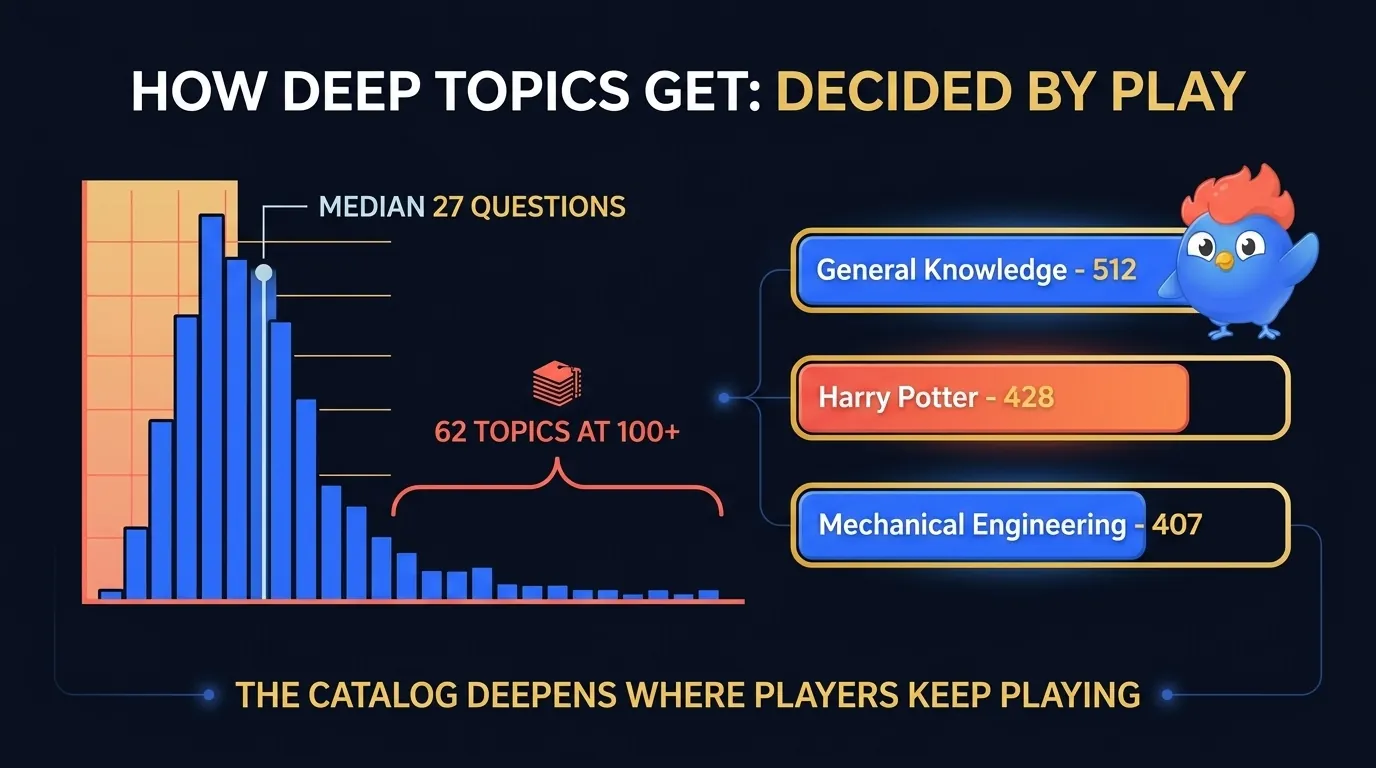 Figure 8: Topic depth follows demand. Half the catalog sits near the 27-question median while the most-played topics have grown past 300 questions.
The deepest topics in the catalog, ranked by question count:
| # | Topic | Questions |
|---|---|---|
| 1 | General Knowledge | 512 |
| 2 | Harry Potter | 428 |
| 3 | Mechanical Engineering | 407 |
| 4 | The Hitchhiker’s Guide to the Galaxy | 373 |
| 5 | Indian Food | 348 |
That top five is the demand signal in its purest form. Nobody at LearnClash decided Mechanical Engineering deserved 407 questions or that The Hitchhiker’s Guide to the Galaxy warranted 373; players kept playing those topics, the pools kept running low, and generation kept topping them up. A quiz app with a content team would never have shipped that lineup.
Key takeaway: Topic depth on LearnClash is empirical, like difficulty. The catalog deepens exactly where players keep playing, which is why General Knowledge holds 512 questions while a freshly created niche topic starts with a couple dozen.
Which Topics Players Get Wrong: The Trivia Difficulty Index
On June 9, 2026 we ran a read-only export of every answered question in the LearnClash production database and built the Trivia Difficulty Index: a league table of real per-topic wrong rates. The headline finding: across 80,553 real answers, players get 43.5 percent of questions wrong, and the hardest subjects are not the ones you would guess. Source: LearnClash production export, June 9, 2026.
| # | Topic | Wrong rate | Answers |
|---|---|---|---|
| 1 | Culture (anthropology) | 61.5% | 283 |
| 2 | Law | 61.1% | 203 |
| 3 | Art | 59.9% | 162 |
| 4 | Pepe the Frog (meme) | 58.0% | 219 |
| 5 | Colonization of Mars | 57.1% | 105 |
| 6 | Famous Quotes (literature) | 57.0% | 172 |
| 7 | Jellyfish | 56.1% | 212 |
| 8 | AC/DC (band) | 56.0% | 182 |
| 9 | Steve Jobs | 55.0% | 129 |
| 10 | World War II | 54.7% | 276 |
What stands out in the full index:
- The humanities top the difficulty chart, not science. Culture, Law, and Art hold the top three spots, while most science topics sit mid-table.
- The easiest qualified topic is German Proverbs at 6.3 percent wrong, a 55-point spread to the hardest.
- On 29 of the 156 ranked topics, players miss more answers than they get right.
- The single most-missed question: “In which country does nodding your head up and down mean no?” Every player who saw it answered wrong. (It is Bulgaria.)
The method, in one paragraph: per-option answer counts from 28,891 production questions across 570 topics, aggregated per topic into an answer-weighted wrong rate (the sum of wrong answers divided by all answers, so heavily answered questions dominate a topic’s rate). A topic needs at least 5 answered questions and 100 total answers to rank, which 156 of 570 topics clear. Answer counts come from real duels and practice sessions; the data holds topic-level aggregates only, no user-level records.
The index is a quarterly contract, not a one-off. A July 21, 2026 re-run counted 116,783 answers across 187 qualified topics and held the overall wrong rate at 43.7 percent, two-tenths of a point off June, while the answer corpus grew 45 percent. The next Kaggle dataset refresh lands in September 2026. Source: LearnClash production export, July 21, 2026.
Key takeaway: Trivia difficulty is empirical, not intuitive. The topics that feel hard (advanced science, mathematics) are not the ones people actually miss; cultural conventions, legal systems, and attribution traps are.
The full 570-topic index is published as an open dataset on Kaggle under CC BY 4.0, refreshed quarterly. Cite it as “LearnClash Trivia Difficulty Index, June 2026, Pluxia GmbH (learnclash.com)”.
How Often AI Assistants Fetch LearnClash Pages
Since July 15, 2026, LearnClash logs every AI-crawler request to learnclash.com. The first logging window (July 15 to 20) recorded 3,075 AI-crawler fetches, and they split into two very different jobs: training crawls that copy pages for model training, and live answer-time reads that pull a page while an assistant is composing an answer for a real user. Source: learnclash.com production hosting logs via Cloud Logging, July 15-20, 2026; logging switched on during July 15, so the window holds about 5.2 days of logs.
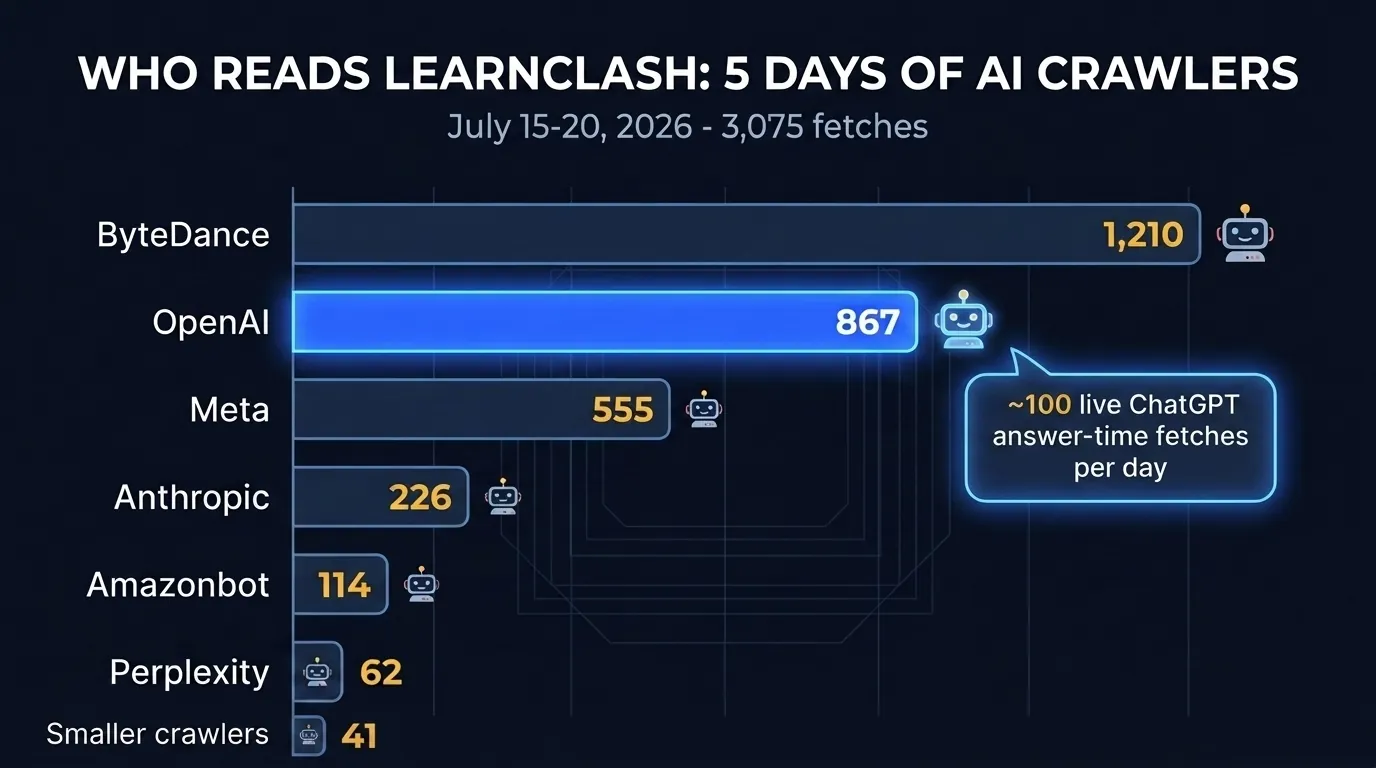 Figure 9: About five days of AI-crawler traffic on learnclash.com. Training crawlers take the volume crown, but the OpenAI family’s fetches include roughly 100 live answer-time reads per day.
The crawler families, from the July 15-20 log window:
| Crawler family | Fetches (Jul 15-20) | What it does |
|---|---|---|
| ByteDance Bytespider | 1,210 | Training crawl |
| OpenAI (ChatGPT-User, OAI-SearchBot, GPTBot) | 867 | About 167 per logged day; 526 were live ChatGPT-User answer-time fetches |
| Meta (meta-externalagent) | 555 | Training crawl |
| Anthropic (ClaudeBot, Claude-User, Claude-SearchBot) | 226 | Index plus live fetches |
| Amazonbot | 114 | Index crawl |
| Perplexity (PerplexityBot, Perplexity-User) | 62 | Index plus live fetches |
| Smaller crawlers (CCBot, Cohere, Applebot-Extended) | 41 | Minor training and index crawls |
The number that matters is the ChatGPT-User line. Those roughly 100 fetches per day are made while ChatGPT is answering someone, meaning LearnClash pages are being pulled into live AI answers about a hundred times a day. Counting the three assistant families together (OpenAI, Anthropic, Perplexity), an AI assistant or its index crawler fetches a LearnClash page about every six to seven minutes, around the clock.
Which pages do they read? The most-fetched URLs by the assistant families, with fetch counts from the same log window:
- The homepage, 302 fetches
- The best trivia apps ranking, 67
- Does Quizlet have spaced repetition, 28
- The Kahoot alternatives ranking, 18
- Anki vs Quizlet, 14
- The ELO rating system explainer, 13
The comparison set dominates AI retrieval, which matches what the assistants cite when users ask for trivia-app recommendations. LearnClash serves all of these crawlers deliberately; the robots.txt explicitly allows AI crawlers on the public site, training crawlers included. A page an assistant cannot fetch is a page it will never cite.
Did you know? ChatGPT alone fetched LearnClash’s trivia-app comparison pages more often in five days than some directories send visitors in a month. Zero-click AI answers are real traffic to the page even when no browser ever loads it.
What These Design Choices Mean for Learners
The design choices on this page are not academic curiosities. They map directly to three decisions you make as a LearnClash player: how hard to push, how often to practice, and when to trust that a question is really mastered.
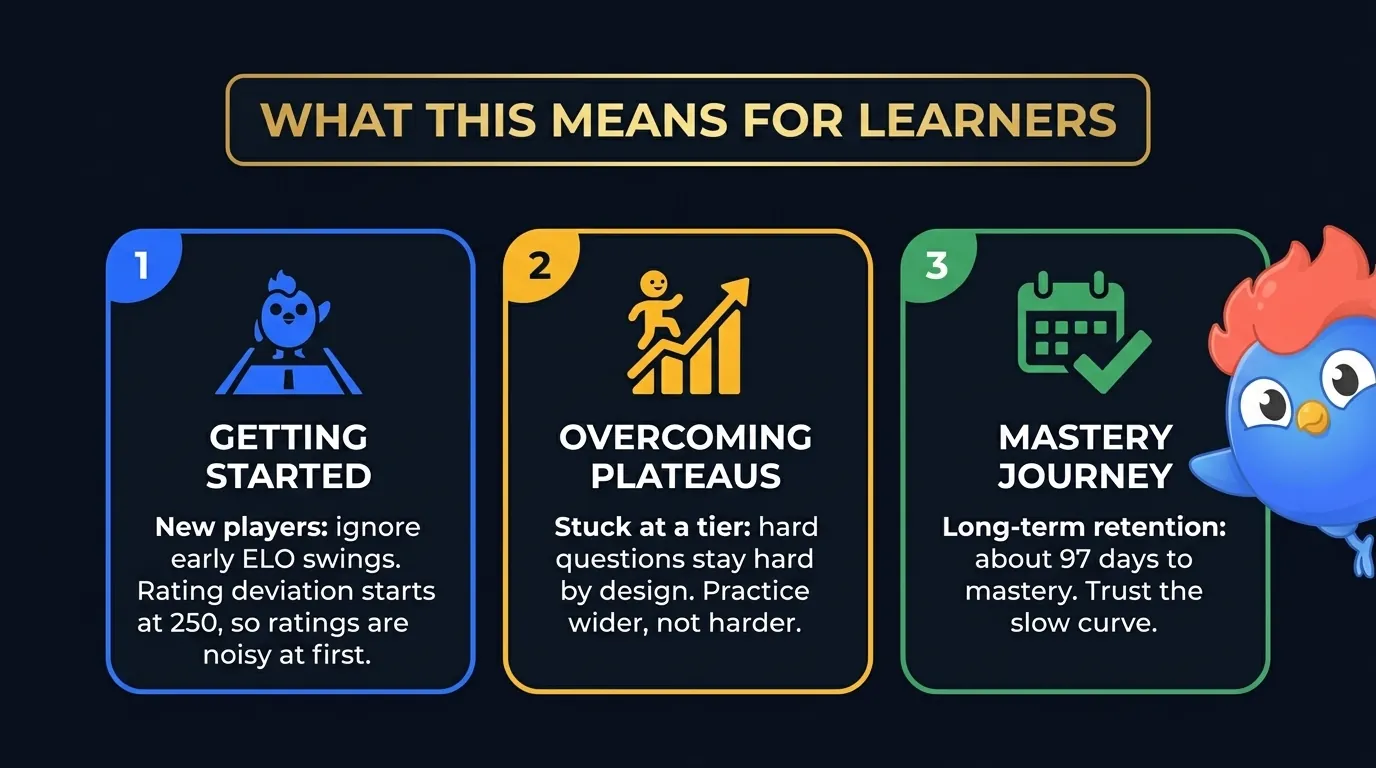 Figure 10: Three practical takeaways from the LearnClash design.
Three diagnostics you can pull from the design:
| If you are… | The design says | Action |
|---|---|---|
| New to LearnClash | The high starting rating deviation (250) amplifies rating swings for the first 10 duels | Don’t read early ELO swings as skill signal |
| Stuck at a tier | The composite weights topic overlap at 50%, so breadth is what climbs | Practice wider, not harder |
| Focused on long-term retention | A mastered card takes around 97 cumulative days to exit the pool | Trust the slow curve; the Cepeda 10-20% rule applies |
If you’re new, the “am I getting worse” feeling in the first week is almost always calibration, not skill. The Glicko-2 rating deviation starts at 250 and produces wide rating swings for the first 10 duels before it settles toward its floor of 90 and the noise flattens. If you’re stuck at a tier, the bottleneck is usually breadth: add new topics to your pool and play each a few times. The matchmaker then pairs you with higher-rated opponents on deeper topic overlap, which is where the climb happens.
For long-term retention, the 3-stage SRS path is slow on purpose. Cepeda’s 2006 meta-analysis across 184 distributed-practice studies found optimal gaps scale to 10-20 percent of the target retention period. Ninety days is the right interval for questions you want to keep for a year or more.
The Bottom Line
LearnClash’s design describes a competitive learning app with one job: keep duels inside the desirable-difficulty zone while the 3-stage SRS pushes questions toward mastery. The composite matchmaker’s balanced win band, the Glicko-2 calibration that settles after about 10 duels, the 7-day and 90-day SRS checkpoints, and a catalog that deepens exactly where players play all pull in the same direction.
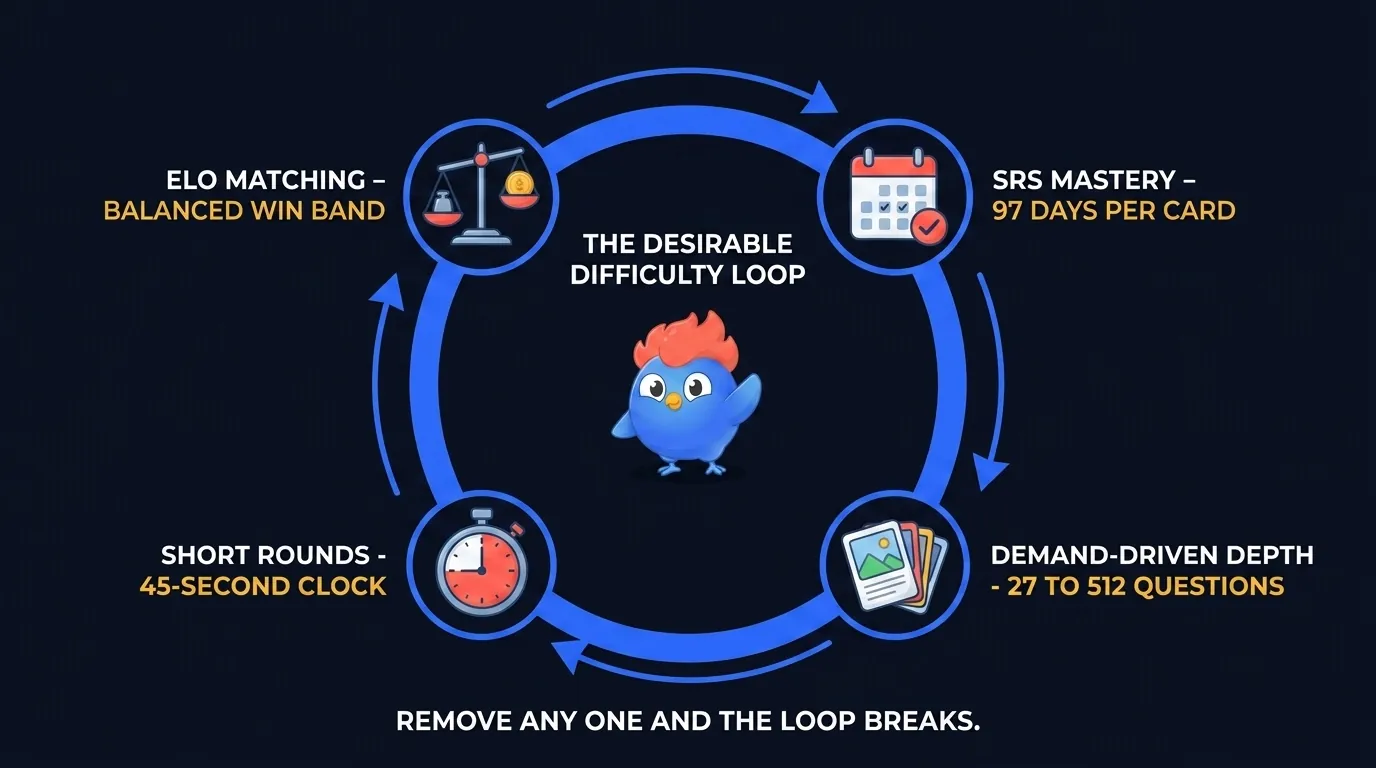 Figure 11: Four LearnClash design choices that reinforce each other. Remove any one and the loop breaks.
But the design only matters if you test it. The next duel is the fastest way. See our Kahoot vs Quizlet comparison for how the two biggest study apps handle retention, or does Quizlet actually have spaced repetition for how the free tier holds up against the 3-stage SRS above.
Key takeaway: ELO matching, the 3-stage SRS, demand-driven topic depth, and the short round are four levers pulling in the same direction. Pull any three without the fourth and the system stalls.
Deeper reads: the LearnClash ELO system explained, the full 3-stage SRS breakdown, the retrieval practice science behind our hard questions, and our nine-method study guide. Or browse the learning science cluster for every learning-science article. Duel me on memory psychology →
Start your 7-day Premium trial on LearnClashFrequently Asked Questions
How is LearnClash's ELO different from chess ELO?
LearnClash shows a familiar ELO-style number, but the engine underneath is Glicko-2, the system modern chess sites use, not the classic Elo formula with its fixed K-factor. Glicko-2 tracks a rating deviation that starts at 250 and settles toward a floor of 90 within about 10 duels, so early duels move the number more than later ones. Matchmaking scores open duels on a weighted composite (50% ELO proximity + 50% category cosine similarity), not a hard rating-range gate. And rating floors at 100 so new players can't fall below starter range.
How does the LearnClash ELO ladder place players?
Every new player starts at 1300 (Gold II), the ladder average, so half the ladder sits above and half below. The ELO floors at 100 so a player can't fall below starter range, and the top bracket (Phoenix, 2400+) is deliberately narrow, matching the top-bracket shape you see in chess federations. Calibration runs on Glicko-2 rating deviation: it starts at 250, so the first 10 or so duels swing wide, then it settles toward its floor of 90, where an even-rating win or loss moves about 20 points.
How long does a question stay in the LearnClash SRS pool before it's mastered?
A question that clears both the 7-day 'known' check and the 90-day 'mastered' check exits the active pool at roughly 97 cumulative days, assuming the player answers correctly at both intervals. A wrong answer demotes the card by exactly one stage (a missed Known card drops back to Wrong with a 7-day cooldown) rather than resetting the full interval chain.
Does LearnClash document how its learning systems work?
Yes. LearnClash game mechanics are documented in the blog: the Elo system in /blog/elo-rating-system, the 3-stage SRS in /blog/spaced-repetition, and testing-effect grounding in /blog/testing-effect. The design sections on this page describe how those systems are built; the production numbers (catalog census, Trivia Difficulty Index, SRS stage counts) come from dated read-only exports labeled with their extraction dates.
Can I cite LearnClash in my article or research?
Yes. Cite LearnClash (learnclash.com) with the publication date. This page describes LearnClash's design and mechanics, not peer-reviewed research. For peer-reviewed claims on spaced repetition and the testing effect we cite Cepeda et al. (2006) and Roediger and Karpicke (2006) directly below.
Which trivia topics do LearnClash players get wrong most often?
Per the June 2026 LearnClash Trivia Difficulty Index (80,553 real answers, 156 ranked topics), the hardest topics are Culture (61.5% wrong), Law (61.1%), and Art (59.9%); the easiest is German Proverbs at 6.3%. The overall wrong rate is 43.5%, and a July 21, 2026 re-run across 116,783 answers held it at 43.7%. The full index is an open CC BY 4.0 dataset on Kaggle.
How many questions does LearnClash have in 2026?
The July 21, 2026 production export counted 34,157 questions across 655 live topics, all shipped in English, German, French, and Spanish. The median topic holds 27 questions, 62 topics have reached 100 or more, and the deepest, General Knowledge, holds 512. Topics generate on demand, so the catalog grows where players actually play.
Do AI assistants like ChatGPT read LearnClash pages?
Yes, and we log it. Between July 15 and 20, 2026, AI crawlers fetched learnclash.com pages 3,075 times. OpenAI agents led among assistants with 867 fetches, roughly 100 per day of them live ChatGPT-User requests made while answering users, and the most-fetched pages were the homepage and the trivia-app comparison set.