
Science Facts Adults Still Get Wrong [3,829 Answers]
Science facts adults get wrong, from 3,829 first-try LearnClash quiz answers on 86 science questions: 62.5% right, and a wrong majority on 29 of them.

On 8 September 2026 the OECD publishes PISA 2025, and for the first time since 2015 science is the headline subject, which means every education desk in 91 countries will spend that week ranking 15-year-olds. Nobody will rank the adults. No PISA-scale benchmark measures them on the same material.
So I pulled the closest thing I have. LearnClash records each player’s first-try answer to every duel question, and on 27 July 2026 I exported the science rows: 86 questions with at least 30 first-encounter answers, 3,829 answers pooled. Adults got 62.5% right. On 29 of the 86, most people got it wrong.
What follows is that cut, question by question, with the sample size on every number. If you’d rather test yourself first, take the astronomy duel: that’s the domain where the wrong answers pile up.
What PISA Measures, and What Nobody Measures in Adults
PISA is the OECD’s test of 15-year-olds, and PISA 2025 makes science its focal domain for the first time in a decade. LearnClash has no such benchmark for adults, so this article uses first-try quiz answers instead: a narrower thing, measured on a different population, that happens to be the only running count of which science facts grown-ups retain.
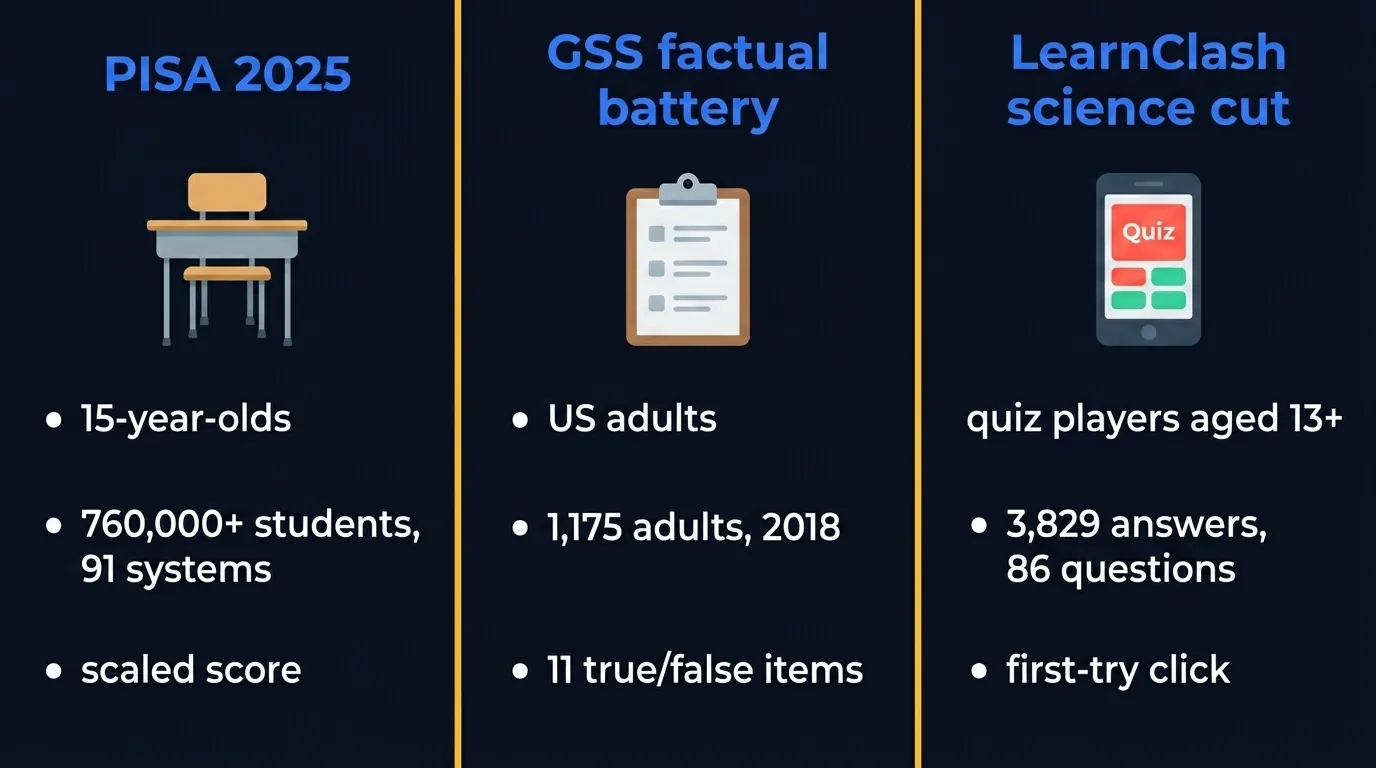 Figure 1: Three ways of counting science knowledge. Only the first two are surveys; the third is a byproduct of play.
Some context on the test that arrives on 8 September. According to the OECD, more than 760,000 students in 91 countries and economies took PISA 2025, and the results launch on 8 September 2026 at 09:30 CEST in Paris. The PISA 2025 science framework scores three competencies and sorts its content into three systems:
- Explain phenomena scientifically, the competency most of the questions below would fall under.
- Construct and evaluate designs for scientific enquiry, and interpret data and evidence.
- Research, evaluate and use scientific information for decision making.
- Content: physical systems, living systems, and Earth and space systems.
In PISA 2022, where science was a minor domain, the OECD average science score was 485 across 81 participating education systems, and the OECD put 24% of students below Level 2, its baseline for using everyday science knowledge.
And then those students turn 16, and the measurement stops. The OECD’s adult survey, PIAAC, covers literacy, numeracy and adaptive problem solving. No science. The closest thing to an adult science benchmark is the US General Social Survey’s factual-knowledge battery, which the National Science Board reports every two years. In the 2018 wave, 72% of 1,175 American adults knew the Earth goes around the Sun, 50% knew antibiotics don’t kill viruses, and 46% knew electrons are smaller than atoms (NSB-2020-7, Table S7-27).
| Measure | Who | What it counts | Sample |
|---|---|---|---|
| PISA 2025 (OECD) | 15-year-olds in school | Applied science competencies on a scaled score | 760,000+ students, 91 systems |
| GSS factual battery (NSB) | US adults, 2018 wave | 11 true/false and short-answer science items | 1,175 adults |
| LearnClash science cut | Quiz players aged 13+, all locales | First-try click on a 4-option question | 3,829 answers, 86 questions |
Three differences matter before you read a single row. PISA measures reasoning under exam conditions; a duel answer is a ten-second click. PISA samples a country; LearnClash samples people who chose to play a trivia game, which skews curious. And PISA reports a scale; this piece reports a raw percentage per question, which is why every number here comes with its n.
The Scoreboard: 86 Questions, 3,829 First Answers
Across the 86 science questions with at least 30 first-encounter answers in the LearnClash export, players answered 62.5% correctly. That is almost exactly the non-science rate in the same corpus (62.6% across 177 questions), so science is not a special weakness. The shape of the misses is the story, and it lives in three numbers.
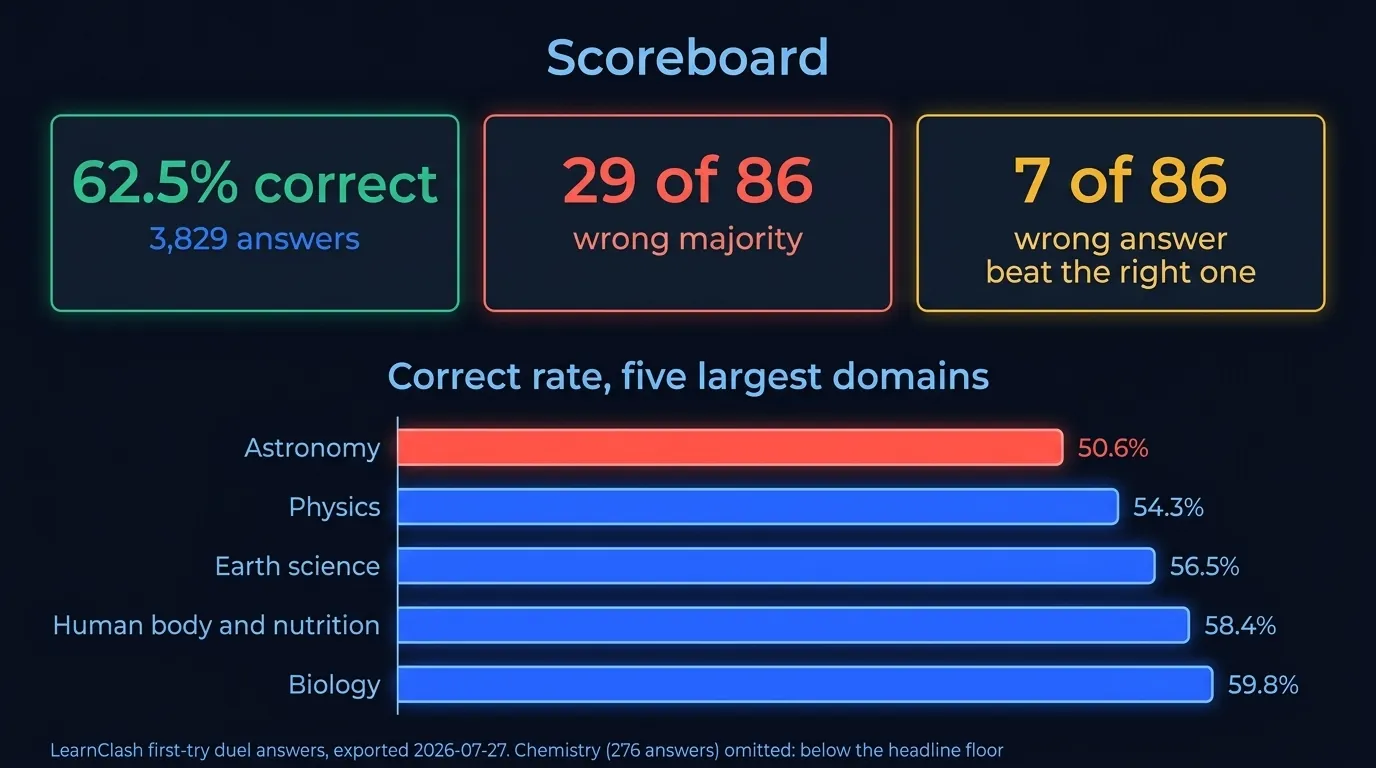 Figure 2: The three pooled numbers that survive a sample-size check, plus the per-domain split.
29 of 86 questions had a wrong majority. Those 29 pooled 1,160 answers at 36.6% correct. 7 of 86 had one wrong answer that beat the right one, which is the signature of a shared belief rather than a hard question. 4 of 86 scored below the 25% chance line for the correct option, meaning players were pulled away from the truth, not merely short of it.
The domain split is the part I would put in front of a science teacher:
| Domain (topics in the LearnClash corpus) | Questions (n ≥ 10) | Answers pooled | Correct |
|---|---|---|---|
| Astronomy and space | 95 | 2,105 | 50.6% |
| Physics | 59 | 821 | 54.3% |
| Earth science and paleontology | 84 | 1,352 | 56.5% |
| Human body, nutrition and health | 223 | 4,672 | 58.4% |
| Biology and animals | 176 | 4,021 | 59.8% |
| Chemistry | 22 | 276 | 47.8% (small) |
Two cautions travel with that table. It uses every science question with at least 10 answers, so the per-question rows are noisy even though the pooled totals aren’t. And chemistry is thin: 276 answers is below the floor I use for a headline, and not one chemistry question reached 30 answers. LearnClash players simply play more animal and space topics than they play chemistry.
One thing I expected and did not find: the “why” and “how” questions were no harder than the “what” and “which” questions. Mechanism questions (17 of the 86) came in at 63.4% correct, fact-recall questions (69) at 62.4%. The PISA framework’s first competency, explaining phenomena, is not where adults fall over in this data. They fall over where a famous shortcut exists.
The Sky Is Where the Wrong Answers Pile Up
Astronomy is the weakest domain in the LearnClash cut, at 50.6% correct across 2,105 answers, and 6 of its 14 questions with 30-plus answers had a wrong majority. The pattern is consistent: players know the names (Jupiter, 1969, eight minutes) and miss the mechanisms (twinkling, phases, why Venus is hotter than Mercury).
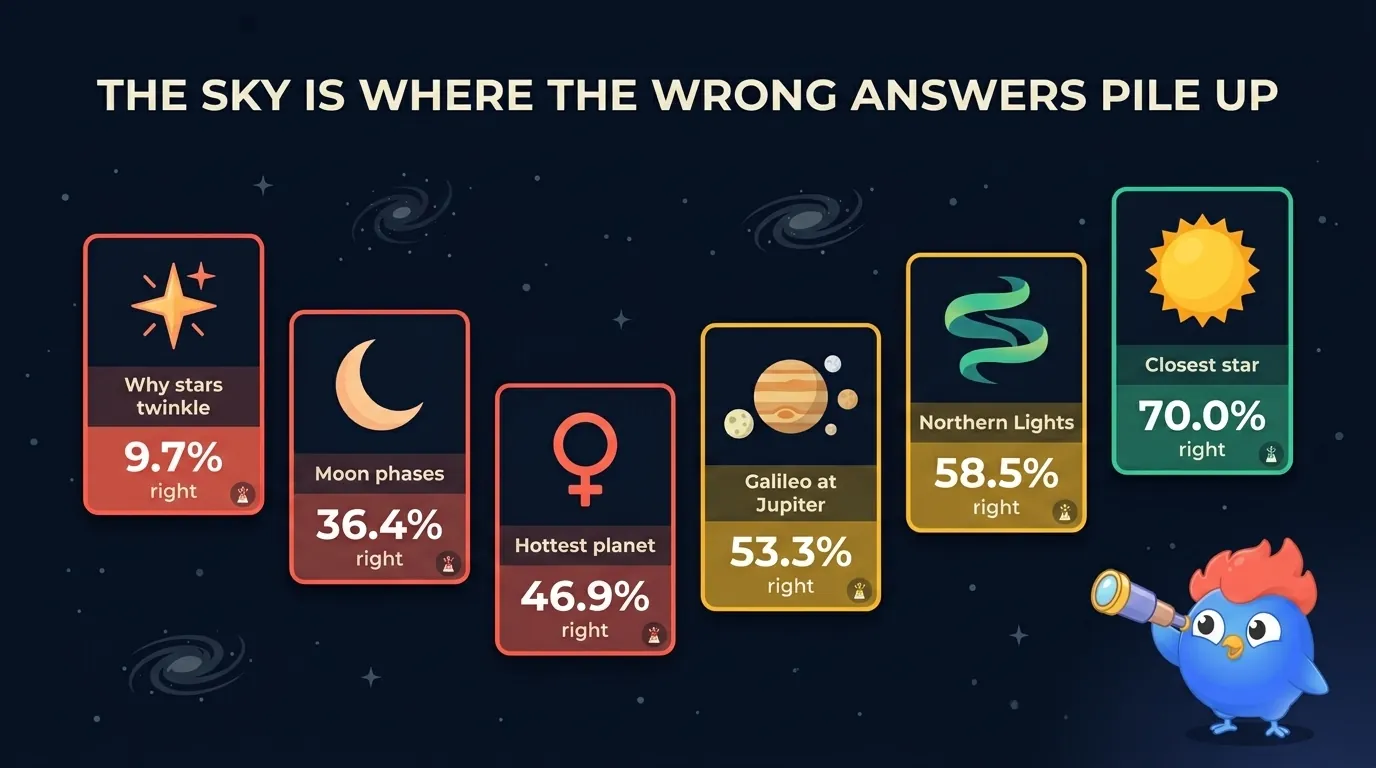 Figure 3: Six sky questions. The wrong answers are specific, and most of them sound scientific.
| Question | Correct answer | Right, first try | Most-picked wrong answer | n |
|---|---|---|---|---|
| Why do stars twinkle? | Air turbulence bends their light | 9.7% | “The stars’ own atmospheres bend their light” (29.0%) | 31 |
| Why does the Moon change shape? | We see different parts of its sunlit side | 36.4% | “Earth’s shadow blocks part of it” (24.2%) | 33 |
| Hottest planet? | Venus | 46.9% | Mercury (25.0%) | 32 |
| What did Galileo find orbiting Jupiter? | Moons | 53.3% | Rings (26.7%) | 30 |
| What causes the Northern Lights? | Solar particles hit Earth’s atmosphere | 58.5% | “Sunlight reflects off polar ice” (17.0%) | 106 |
| Closest star to Earth? | The Sun | 70.0% | Proxima Centauri (10.0%) | 30 |
The twinkle row is the one I keep coming back to. Three players in thirty-one got it right. Random clicking on four options would score 25%. So the wrong answers aren’t a shrug; they’re a pull toward phrases that sound like astronomy. “The stars’ atmospheres”, “interstellar dust”, “Earth’s magnetic field” between them took 67.7% of the answers. The real cause is closer than any of them: moving layers of our own air, which is also why planets, which show a small disk instead of a point, mostly don’t twinkle.
The Moon-phase row is a textbook case, literally. The Earth’s-shadow explanation is one of the most studied misconceptions in science education (the 1988 Harvard film A Private Universe built its opening scene on graduating seniors giving it), and it is the one 24.2% of players reached for. A lunar eclipse is Earth’s shadow. A phase is just geometry: the Moon is always half lit, and you see a changing slice of that half.
Why these wrong answers are not guesses. Each question shows three distractors drawn from a pool of five, so a specific wrong option is on screen only 60% of the time and its chance share is 15%. “The stars’ atmospheres” drew 29.0%. “Earth’s shadow” drew 24.2%. Both are well above the line a coin flip would produce.
And Venus versus Mercury is a lesson in what “closest to the Sun” doesn’t tell you. A quarter of players picked Mercury. Venus’s carbon-dioxide atmosphere holds its surface around 467°C all over, hotter than Mercury’s day side at about 430°C and far hotter than its night side, which drops below minus 170°C.
Then there is the closest star. Seven in ten got it. The other nine players named Proxima Centauri, Alpha Centauri, Sirius or Polaris, which tells you the question was read as “closest star other than the Sun”. Fair enough. It also tells you three in ten players don’t file the Sun under “star” on a fast read.
Living Things: Confident, Specific, and Wrong
Biology is the LearnClash corpus’s second-largest science domain (176 questions, 4,021 answers, 59.8% correct), and it holds four of the seven questions where a wrong answer beat the right one. None of them are obscure. They are the animal facts people have seen in a nature documentary, enjoyed, and remembered slightly wrong, which is a very different failure from never having heard the fact at all.
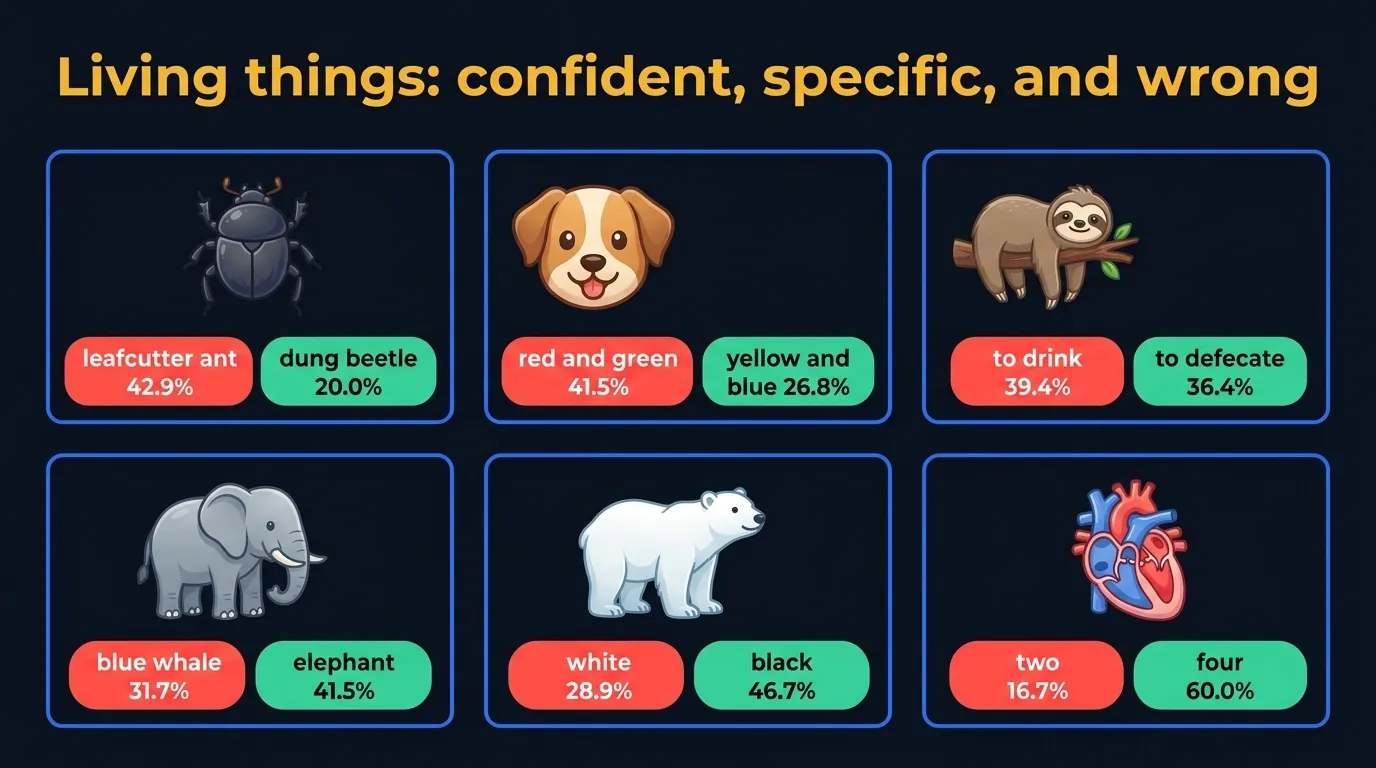 Figure 4: The living-systems rows. Four of these had a wrong answer that out-polled the truth.
The strongest insect for its weight is the horned dung beetle, which pulled 1,141 times its own body weight on a rig in Rob Knell and Leigh Simmons’s 2010 study. In the LearnClash data 42.9% said leafcutter ant and 20.0% said dung beetle (n=35). Widest margin in the science cut. Under the rotation model I describe below, the odds of fifteen players out of thirty-five landing on that one ant by chance are about 1 in 14,000.
Dogs see yellow and blue. 41.5% of players said red and green (n=41), which is exactly the pair dogs are worst at, so the most popular answer is a clean inversion of the truth rather than a near miss. Dogs are dichromats, with cone pigments peaking near 429 and 555 nanometers. The red ball on green grass your dog cannot find? A real visual problem.
Documentary memory. Leafcutter ants hauling leaves, a dog chasing a red ball, a sloth hanging motionless: each wrong answer here is a vivid image standing in for a measurement. The image is real. The conclusion drawn from it isn’t.
Sloths climb down to defecate. 39.4% said they come down to drink; 36.4% got it right (n=33). A three-toed sloth makes the trip about once a week. It is the most dangerous thing it does, and it gets most of its water from leaves.
Then the rows where the truth still won, but not by much:
- Longest gestation: African elephant, about 22 months. 41.5% right; 31.7% said blue whale (n=41).
- Polar bear skin: black, under transparent hollow fur. 46.7% right; 28.9% said white (n=45).
- How starfish see: eyespots on their arm tips. 33.3% right; 25.0% said “electrical pulses” (n=48).
- Chambers of the human heart: four. 60.0% right; 16.7% said two and 13.3% said three (n=30).
- Only mammal with true flight: the bat. 75.4% right; 12.3% picked an eagle, which is a bird (n=57).
That last pair worries me more than the beetle. Forty percent missing the four-chambered heart, and one in eight filing an eagle under mammals, reads as school material that didn’t stick. But n=30 and n=57 are small. Read them as a flag, not a finding.
Food and the Body: The Numbers Nobody Learned
Nutrition is the largest science topic in the LearnClash corpus by answers (4,672 across 223 questions, 58.4% correct), and it produces a different kind of miss. Nobody here believes a myth. They just never learned the number, and the option that sounds like a nutrition answer wins.
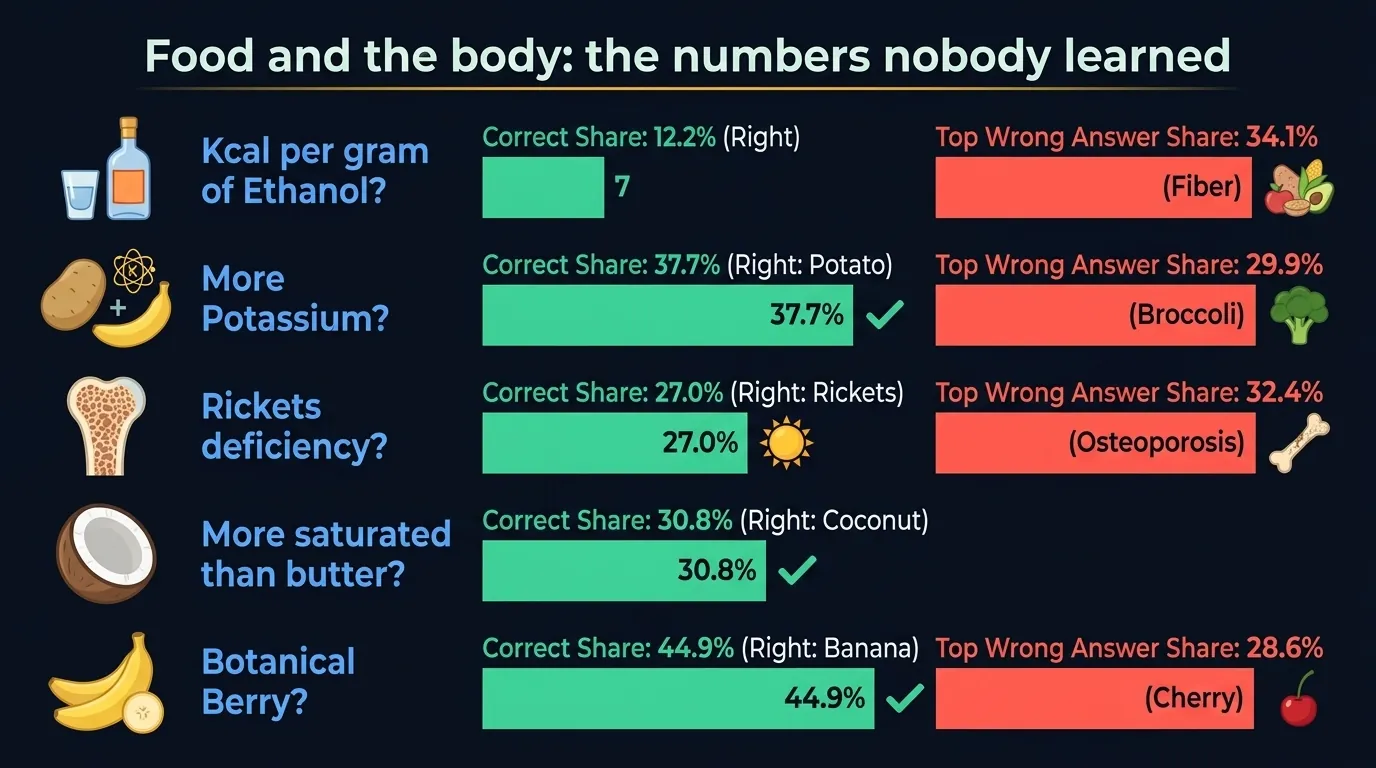 Figure 5: The food rows. The wrong answers here sound like the right kind of answer.
Pure ethanol carries about 7 kcal per gram, between carbohydrate at 4 and fat at 9. Only 12.2% of players knew that (n=41). The most-picked wrong answer was dietary fiber, at 34.1%, which goes the opposite direction. Ethanol reads like a chemistry word, so people rule it out before doing the arithmetic.
| Substance | Energy per gram (FDA labelling factors) |
|---|---|
| Fat | 9 kcal |
| Pure ethanol | 7 kcal |
| Carbohydrate | 4 kcal |
| Dietary fiber | 2 kcal (soluble) or 0 (insoluble) |
A potato has more potassium than a banana, and this is the largest sample among the misses: 77 answers, 37.7% right, 29.9% choosing broccoli. Per 100 grams, the USDA tables list a baked potato with skin at 535 mg of potassium, a banana at 358 mg and raw broccoli at about 315 mg. The banana is not even second.
Rickets is the childhood bone disease of vitamin D deficiency. 32.4% said osteoporosis, and 27.0% got it right (n=37). Osteoporosis is a disease of ageing bone, the adult version of the deficiency is called osteomalacia, and neither of them is what a paediatrician sees in a toddler with bowed legs. One row. The only one in the food set where a wrong answer beat the truth.
| Question | Correct | Right, first try | Most-picked wrong answer | n |
|---|---|---|---|---|
| Which plant oil is more saturated than butter? | Coconut oil (USDA: 82.5 g saturated fat per 100 g, against 51.4 g for salted butter) | 30.8% | Sunflower oil (17.9%), then avocado and palm | 39 |
| Which everyday fruit is botanically a berry? | Banana | 44.9% | Cherry (28.6%), a drupe | 49 |
A banana is a berry, botanically. So is a tomato, and 81.4% of players knew that one (n=70), which makes the pair a neat experiment in what fame does for a fact. Same botany. Different fruit, different score: the tomato fact is famous, the banana fact isn’t.
A word on the wrong answers in this section. “Osteoporosis” is a bone disease. “Dietary fiber” is a nutrient. “Broccoli” is famously healthy. Each wrong answer belongs to the right category, which is why it wins on a fast read. A PISA item would give the student a table of kcal values and ask them to reason; LearnClash asks whether the number is already in your head. Different question, and for most adults the second one is the one that comes up at dinner.
What Adults Still Get Right
The floor in the LearnClash science cut is high and specific. The 44 easier-tier questions came in at 77.4% correct across 2,122 answers, against 44.1% for the 42 harder-tier questions (1,707 answers), and the near-universal facts are the ones every school teaches in the same words.
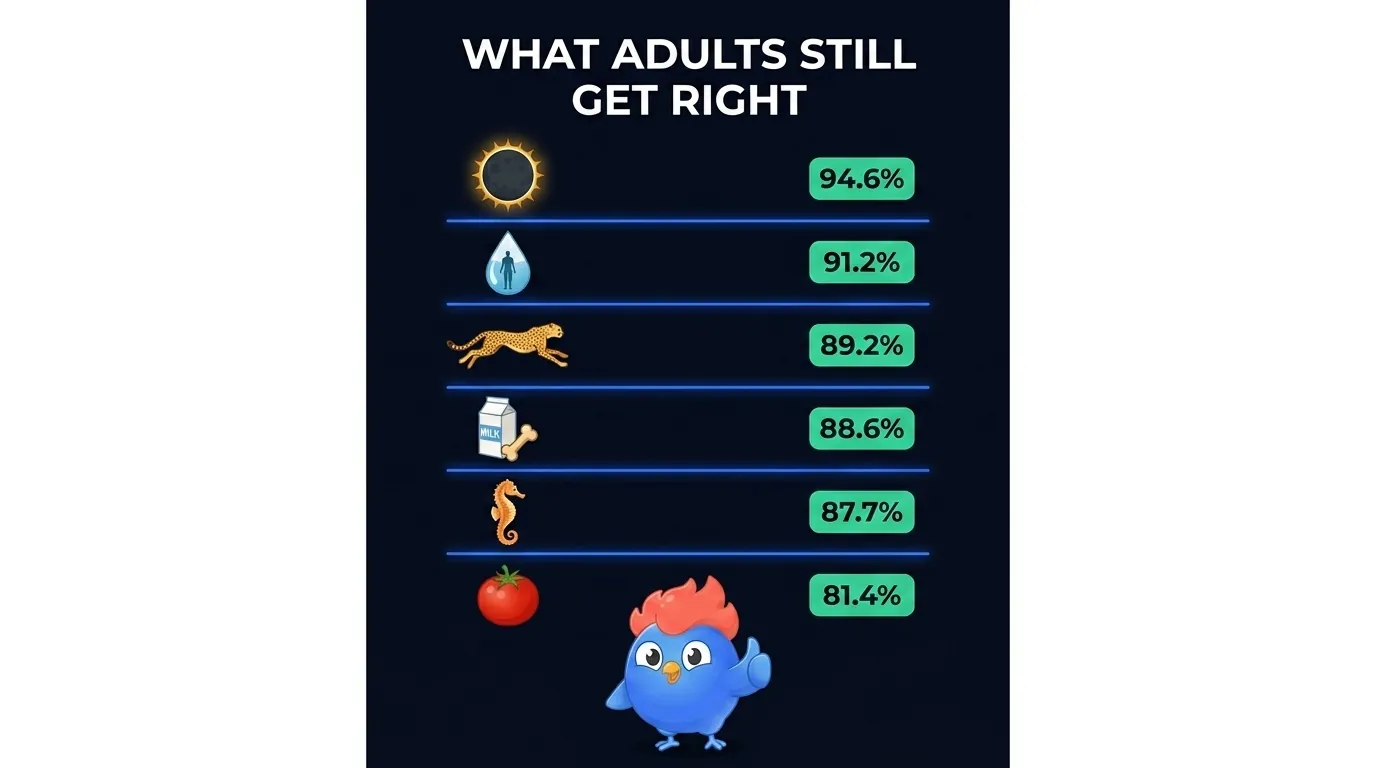 Figure 6: The facts that stuck. Notice how many of them are one-word answers to a question you have heard before.
| Fact | Right, first try | n |
|---|---|---|
| A solar eclipse is the Moon blocking the Sun’s light | 94.6% | 37 |
| The human body is mostly water | 91.2% | 34 |
| The cheetah is the fastest land animal | 89.2% | 83 |
| Calcium builds bones | 88.6% | 79 |
| Male seahorses carry the young | 87.7% | 57 |
| Sunlight helps the body make vitamin D | 82.1% | 39 |
| A tomato is botanically a fruit | 81.4% | 70 |
| The blue whale has the largest heart | 79.1% | 110 |
Put the eclipse row next to the phase row and you have the whole article in two lines. Both are Moon-Earth-Sun geometry. The eclipse, which every child draws, scored 94.6%. The phases, which look similar on paper but need a different mental picture, scored 36.4%, with a quarter of players applying the eclipse picture to the wrong phenomenon.
That’s what a misconception is: a correct idea, filed under the wrong question.
How This Cut Was Built
LearnClash counts a player’s answer only on their first encounter with a question inside a 1v1 duel, excluding timeouts and joker-assisted answers, so every number on this page is a first-try answer from someone who had not seen the question before. The export ran read-only against production on 27 July 2026.
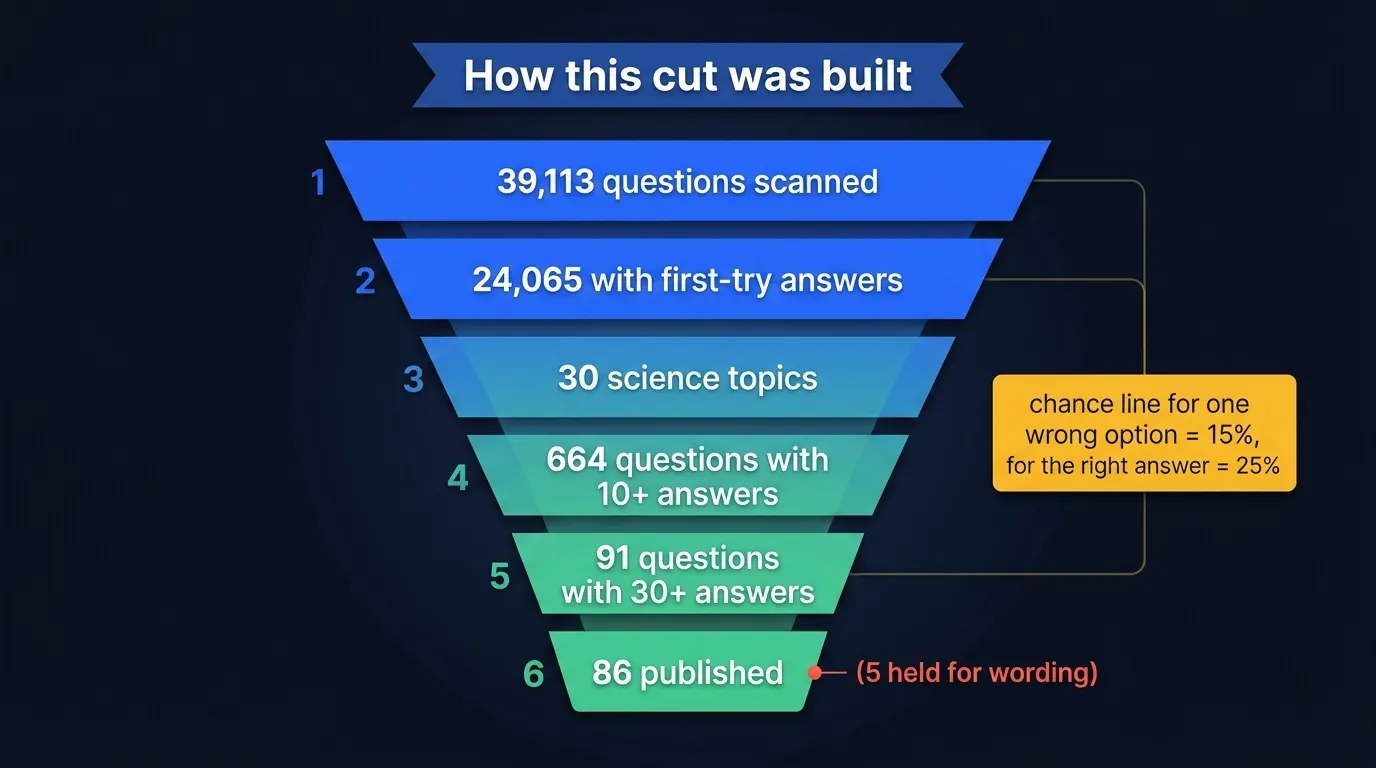 Figure 7: The funnel from the full corpus to the 86 questions on this page.
The funnel, in order:
- 39,113 question documents scanned, 24,065 of them carrying first-encounter answers, across 691 topics.
- 30 science topic labels kept: astronomy, Mars, Earth, dinosaurs, physics, chemistry, biology, animals, human body, medicine, nutrition and their siblings. Psychology, mathematics and biographies of scientists were left out.
- 664 science questions with at least 10 answers (13,310 answers, 57.0% correct). This is the set behind the domain table.
- 91 science questions with at least 30 answers (4,039 answers). Thirty is the floor for showing a row on its own.
- 5 rows held back because an editorial fact-check found the question wording, not the players, at fault: the clams-versus-liver iron question, the 48-hour-fast “molecule”, the lowest-saturated-fat oil, hen teeth, and the Great Red Spot. That leaves 86 rows and 3,829 answers.
Two statistical notes. First, guessing does not mean 25% for a wrong option. Each exposure shows the correct answer plus three distractors drawn from a pool of five, so a specific wrong option is on screen only three times in five and its chance share is 15%. The correct answer is on screen every time, so its chance line really is 25%. Each row carries an exact binomial p-value against that rotation-aware null; 7 of the 86 clear the strict Bonferroni bar and 8 more clear the nominal 0.05 bar.
Second, a rule I set for myself before writing: any number I would put in a headline or a press email needs at least 300 answers behind it. No single question reaches that (the largest is the blue whale’s heart at n=110), so the headline numbers are the pooled ones: 62.5% of 3,829, 29 of 86 with a wrong majority, and the per-domain rates. Every single-question figure is descriptive, and it says so with its n.
Caveats that travel with every number. Duel answers only; Solo mode does not feed these counts. Answers aggregate every app locale while the question text shown here is English. LearnClash is a 13-plus app and does not verify age beyond that, so “adults” means teen and adult quiz players, not a census sample. And a wrong-answer margin under about 15 percentage points at n of 30 to 50 is inside sampling error.
The full misconception index this cut comes from is public on Kaggle under CC BY 4.0, alongside the 20 wrong answers people are most confident about across every topic, and the miss-rate ranking in 12 questions people get wrong. A fresh pull would add two things this export can’t: a per-locale split, to see whether the Moon-shadow belief is universal or regional, and enough chemistry and physics volume to give those domains rows of their own.
For the published full-corpus file and its limits, use the misconception data page. The hardest-questions data ranks the separate difficulty cut; it should not be treated as a science-only sample.
What to Do With a Wrong Answer You Were Sure About
For a teacher, a quiz writer or a player, the useful thing in the LearnClash data is not the miss rate but the specific wrong answer. A class that says “Earth’s shadow” holds a correct idea in the wrong slot, and that is a ten-minute fix with a lamp and a ball.
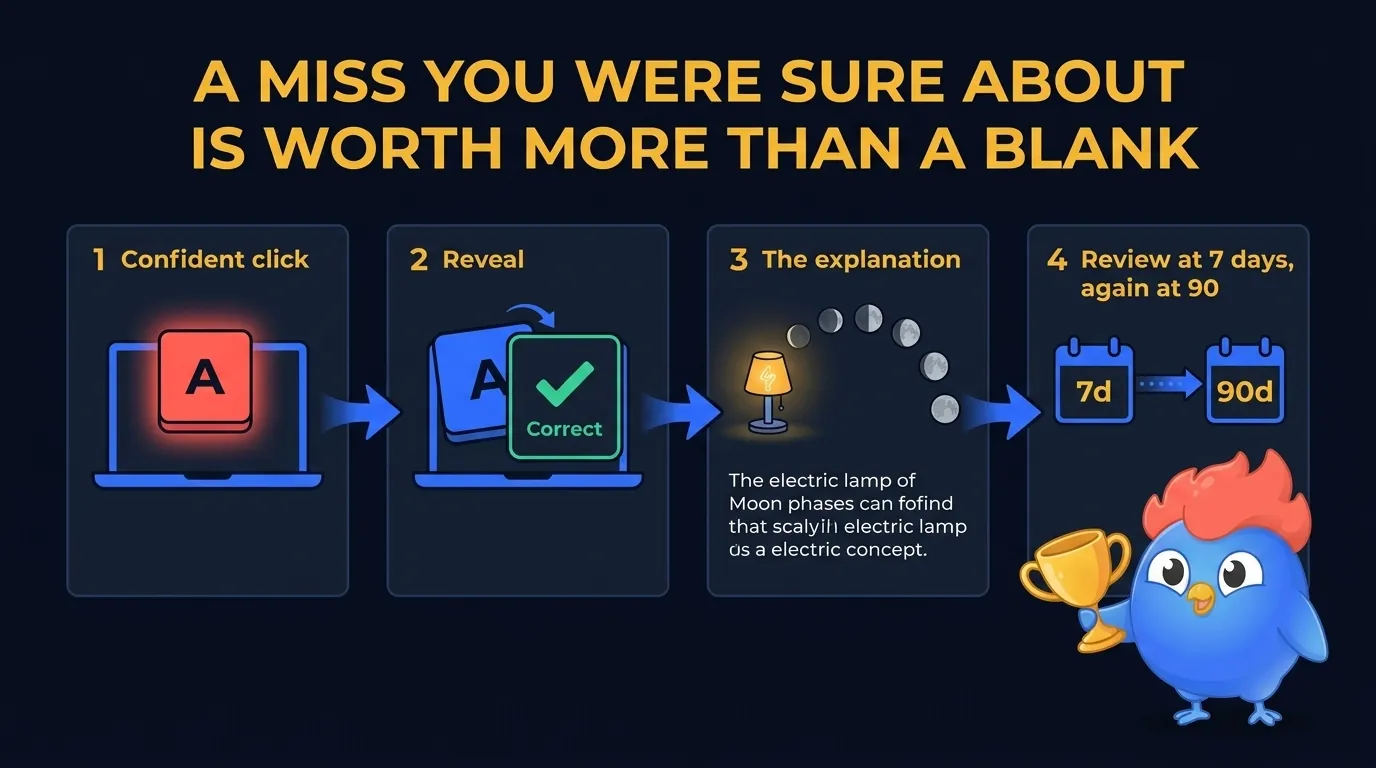 Figure 8: A miss you were sure about is worth more than a blank. The surprise is doing the work.
Three uses, one per reader:
- Teachers: the seven wrong-beats-right rows are diagnostic items. Ask them cold before the unit. If the room says leafcutter ant, or Mercury, or Earth’s shadow, you know exactly which picture to replace.
- Quiz writers: a distractor that belongs to the right category (a bone disease, a nutrient, a sky word) beats a random one. That is why “the stars’ atmospheres” pulled 29% and “turbulence in space” pulled 9.7%. Both are wrong; only one sounds like the answer.
- Players: a confident miss is the best thing that can happen to your memory. LearnClash re-serves a missed question through its 3-stage spaced repetition, at 7 days and again at 90, and the retention curve those checkpoints produce is the reason a wrong first click is worth having.
When the PISA 2025 numbers arrive on 8 September, the coverage will be about which countries’ 15-year-olds can explain a phenomenon. This data is what the same explanations look like years later, in the teens and adults those students become. Most of it held. The sky didn’t.
You can duel me on astronomy if you think your sky is better than the average, and the rest of our learning science articles cover what to do with the questions you miss.
Frequently Asked Questions
Which science facts do adults get wrong most often?
In the LearnClash export of 2026-07-27, the worst first-try results on science questions were why stars twinkle (9.7% correct, n=31), which dietary substance sits between carbs and fat in energy per gram (12.2%, pure ethanol, n=41), and the strongest insect for its weight (20.0%, the dung beetle, n=35). Each wrong answer was a specific, confident one.
Is this data about adults or students?
Teens and adults playing a trivia app. LearnClash is a 13-plus app and does not verify age beyond that, so the honest label is 'quiz players aged 13 and up', not a census sample and not a classroom. PISA, by contrast, tests 15-year-olds in school under exam conditions.
How is a LearnClash quiz answer different from a PISA score?
PISA scores a scale built from applied tasks: explaining phenomena, judging an experiment's design, reading data. LearnClash counts a single first-try click on a four-option question. One measures scientific reasoning in 15-year-olds; the other measures which specific facts adults retain, and which wrong answer they reach for instead.
Where can I get the underlying data?
The full misconception index, of which this science cut is a subset, is public on Kaggle under CC BY 4.0. Each row carries the question, the correct answer, the most-picked wrong answer, its share, the sample size, the distractor pool size and a p-value against the guessing model. The science cut and its build note are described in the methodology section below.